Technical Information
Updated Results of Surface Displacement caused by the Sanriku Offshore Earthquake
These figures show the distribution of co-seismic surface displacement caused by the 2026 Sanriku-Oki Earthquake (7:52 AM (UTC) on April 20, 2026; M7.7), derived from the differential interferometric SAR (DInSAR) analysis using Sentinel-1 C-band SAR data.
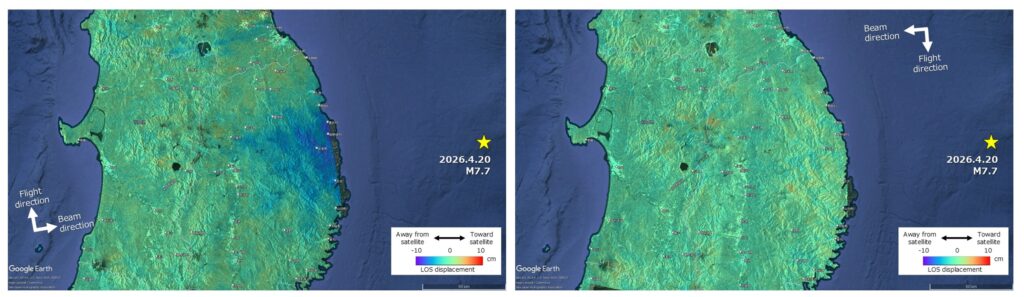
Fig.1 Line-of-Sight Displacement
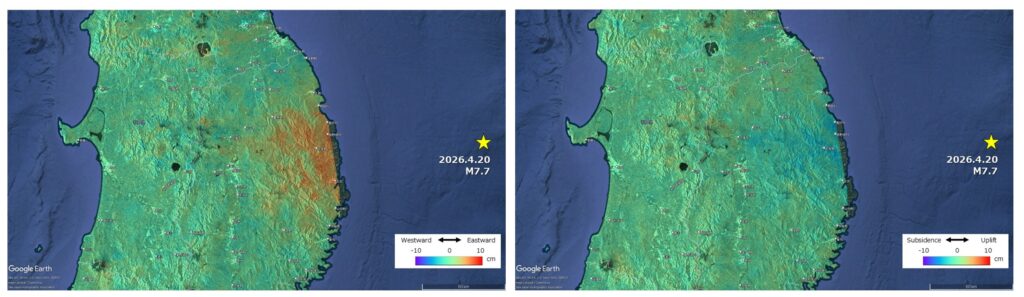
Fig.2 Quasi-east-west and Quasi-vertical Displacement
Sentinel-1 data acquired at around 8:34 AM (UTC) on April 9 and April 21, 2026, and at around 8:42 PM (UTC) on April 8 and April 20, 2026, from an ascending orbit and a descending orbit, respectively, were used for DInSAR processing. The yellow star in the figure indicates the location of the epicenter, as announced by the JMA. Fig. 1 shows the distribution of displacement along the Line of Sight (LOS) direction of SAR illumination. Negative values indicate displacement away from the satellite; in the ascending orbit, this indicates subsidence, eastward displacement, or both, while in the descending orbit, it indicates subsidence, westward displacement, or both. In the ascending orbit, a maximum surface displacement of approximately 7 cm away from the satellite was observed, primarily along the Pacific coast of Iwate Prefecture. Fig. 2 shows the distribution of quasi-east-west and quasi-vertical displacements derived from the multi-track analysis, which combines LOS displacements of the ascending and the descending orbit pairs. Eastward displacement of up to approximately 8 cm was observed, centered along the Pacific coast of Iwate Prefecture. The distribution pattern of the displacements is concordant with the map derived from GEONET data (https://www.gsi.go.jp/chibankansi/chikakukansi_20260420_sanrikuoki.html).