



Technical Information
Preliminary Results of Surface Displacement caused by the 2026 Venezuela Earthquakes
These figures show the distribution of co-seismic surface displacement caused by the 2026 Venezuela earthquakes (M7.2 at 10:04 PM and M7.5 at 10:05 PM on June 24, 2026 (UTC)), derived from differential interferometric SAR (DInSAR) analysis using Sentinel-1 C-band SAR data.
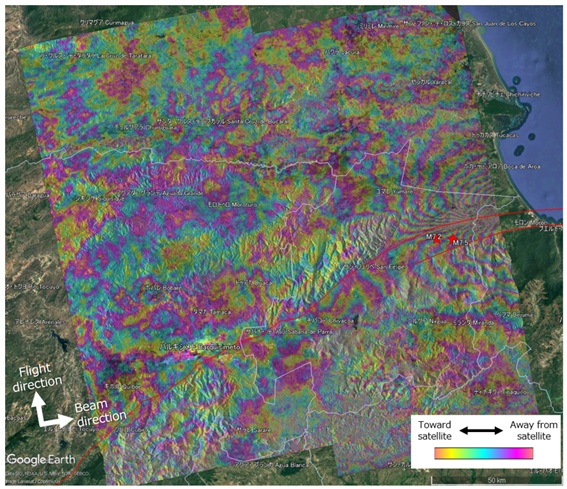
Fig.1 Differential Interferogram
(The red star indicates the epicenter location announced by the USGS. The red lines indicate the faults acquired from the Global Earthquake Model (GEM) Foundation. Sentinel-1 SAR data are C-band (wavelength = 5.6 cm), where one cycle of phase change corresponds to surface displacement of half a wavelength (2.8 cm) in the satellite’s line-of-sight (LOS) direction. A decrease in phase indicates a decrease in distance, which corresponds to movement toward the satellite.)
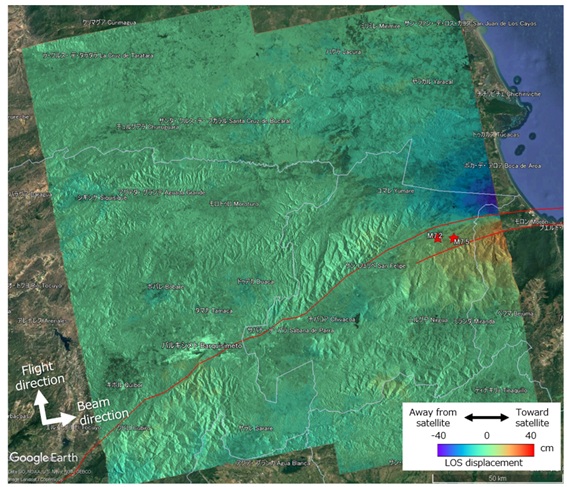
Fig.2 Line-of-Sight Displacement
(The red star indicates the epicenter location announced by the USGS. The red lines indicate the faults obtained from the Global Earthquake Model (GEM) Foundation. Positive values indicate displacement toward the satellite, which indicates uplift, westward displacement, or both.)
Sentinel-1 data acquired from an ascending orbit before and after the two earthquakes on June 23 and 24, 2026 (UTC), were used for DInSAR processing. Figure 1 shows the differential interferogram, and Figure 2 shows the line-of-sight displacement. These earthquakes originated from a fault located at the plate boundary between the South American plate and the North Andean plate. Displacement moving away from the satellite is observed on the northern side of the fault, while displacement moving toward the satellite is observed on the southern side.
Please note that these figures are preliminary, and no corrections have been applied for the atmospheric delay and other effects.