Seismic Survey Data Processing
and Analysis Services
Table of Contents
Standard Data Processing
Reflection seismic data acquired in the field can be processed into interpretable data for understanding subsurface structures and properties by following appropriate data processing procedures. The processing workflow is designed considering the survey’s target, geological structure, and the type and intensity of noises present in the field records. The most fundamental processing steps used in reflection seismic surveys are shown below.
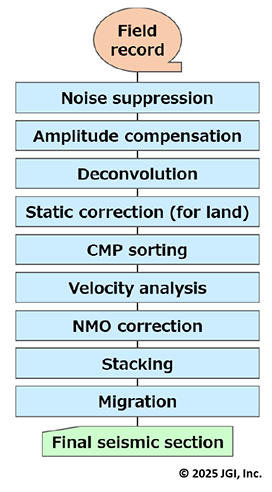
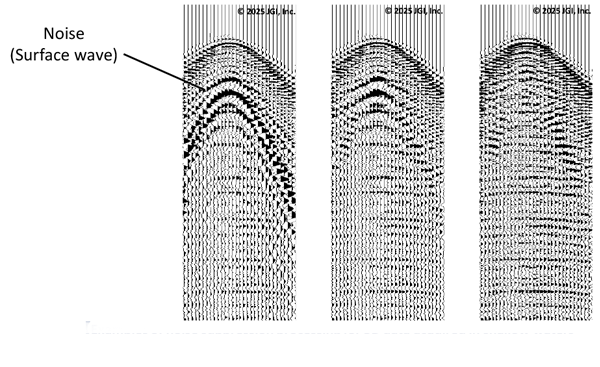
1.Noise suppression
Reflection seismic data contain various types of noises originating from near-surface environments and subsurface structures. Noise suppression processing is necessary to reduce those noises and enhance reflections from geological interfaces. Commonly used noise suppression methods are shown below.
■ Data-Adaptive Time Variant Filter (DATVF)
This method calculates the average amplitude within a specific frequency range for each subdivided time gate and down-scales the amplitude for gates with abnormally high amplitude compared to the other gates. It can suppress noise that is localized in time and space and has a different frequency band from the reflected waves.
■ Trace Edit in Frequency-Space Domain (F-X Edit)
This method detects bad traces by comparing amplitudes in the frequency domain over a time and space date and replace them with noiseless traces predicted from the surrounding normal data within the gate. It is used to suppress spatially localized noise such as swell noise and traffic noise.
2. Amplitude compensation
Reflected waves from deep underground are attenuated in amplitude, so amplitude compensation is applied to recover this.
3. Deconvolution
Elastic waves acquired in the field are deformed by various factors such as the source waveform and the characteristics of data acquisition system, making it impossible to accurately represent the subsurface image with the original waveforms. Therefore, they are converted into sharp, pulse-like waveforms where a single isolated reflection wave corresponds to a single reflection surface.
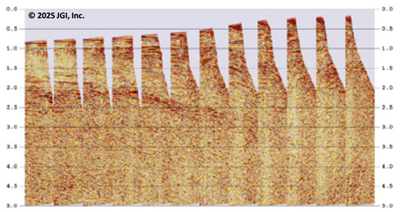
4. Static Correction
In the case of land data acquisition, velocity and thickness variation in the near-surface weathered layers and changes in elevation affect the arrival time of reflected waves as time shift in the seismic traces. Static correction is to apply static time shift to each seismic trace correct the near-surface The amount of time shift is calculated from first arrival times of the refracted waves propagating directly beneath the weathered layer using either layer-based delay time method or grid-based tomographic approaches.
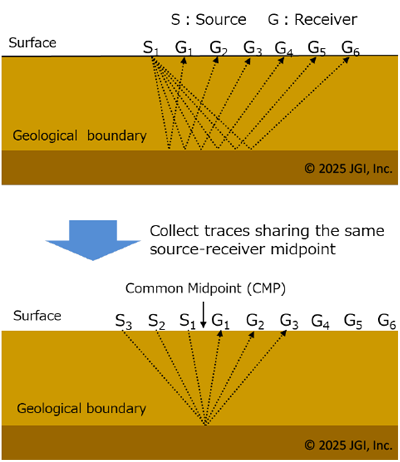
5. CMP sorting
Seismic data recorded in the field is rearranged based on Common Mid-Point (CMP), creating a collection of data (CMP gather) that can be considered to have reflected from the same subsurface point.
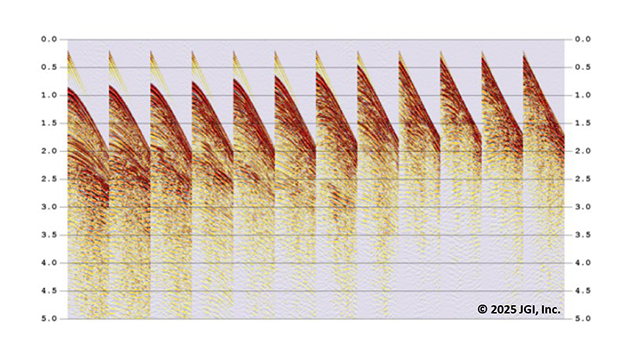
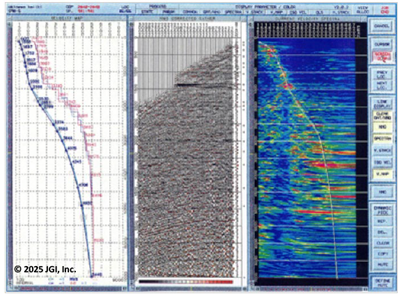
6. Velocity analysis
Using the data after CMP sorting, the propagation velocity of elastic waves through the strata is analyzed, and the results are used for subsequent processing such as NMO correction and migration. Furthermore, the obtained velocity information may also be used to estimate rock and fluid types. We efficiently analyzes highly accurate velocity information by utilizing dedicated in-house and commercial software.
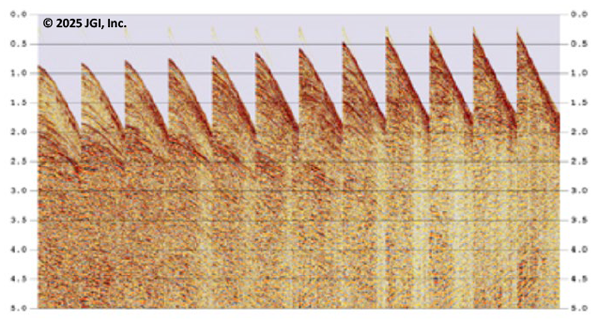
7. NMO (Normal Move Out) Correction
Using the velocity model obtained from velocity analysis, seismic traces with different source-receiver distance are virtually transformed into data as if the source and receiver are co-located. This processing step corrects the time delay of the recorded reflection data, making all the reflected waves horizontal in a CMP gather.
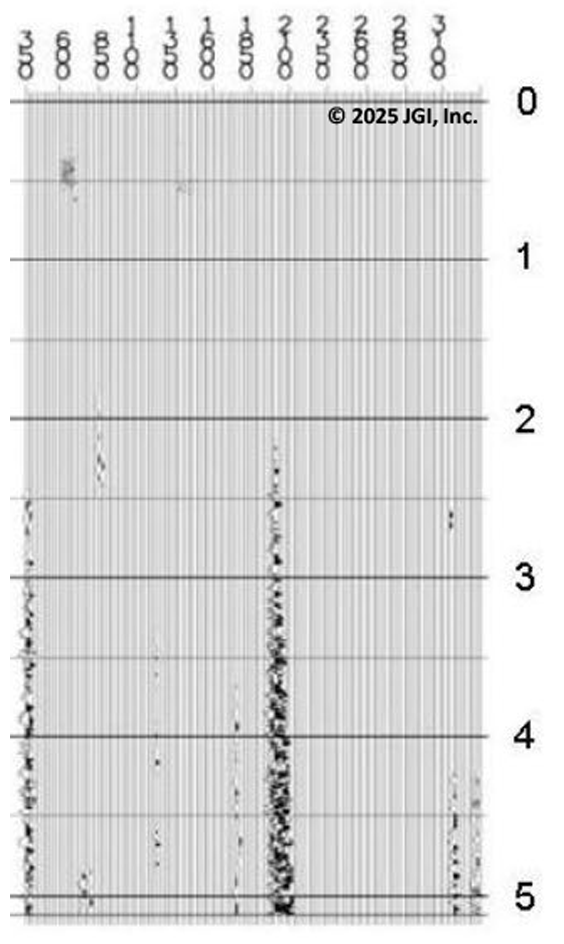
8. Stacking
By summing tens to hundreds of seismic traces that can be considered to have reflected from the same subsurface location into a single dataset, unwanted waves (noises) are cancelled, and useful reflected waves (signals) are enhanced, creating a stacked seismic section (stacked record section) with higher SN ratio.
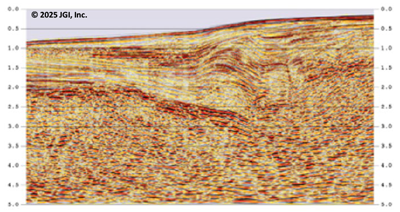
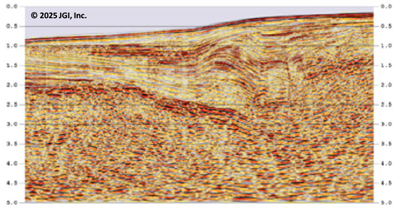
9. Migration
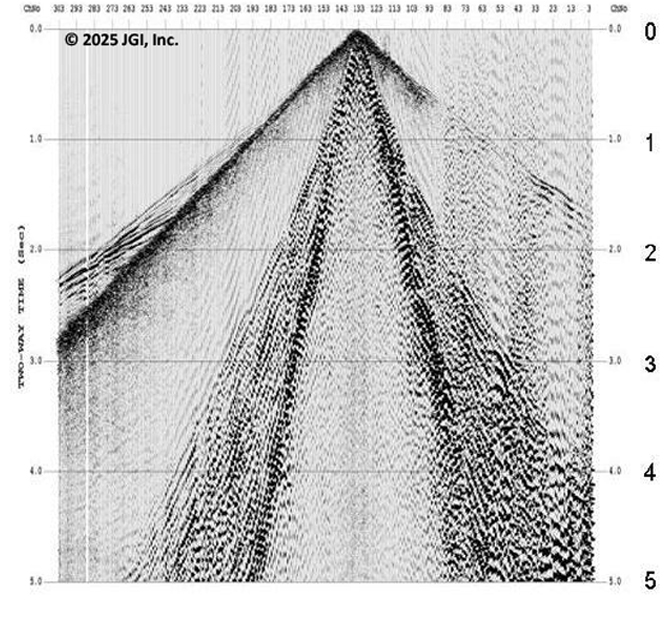
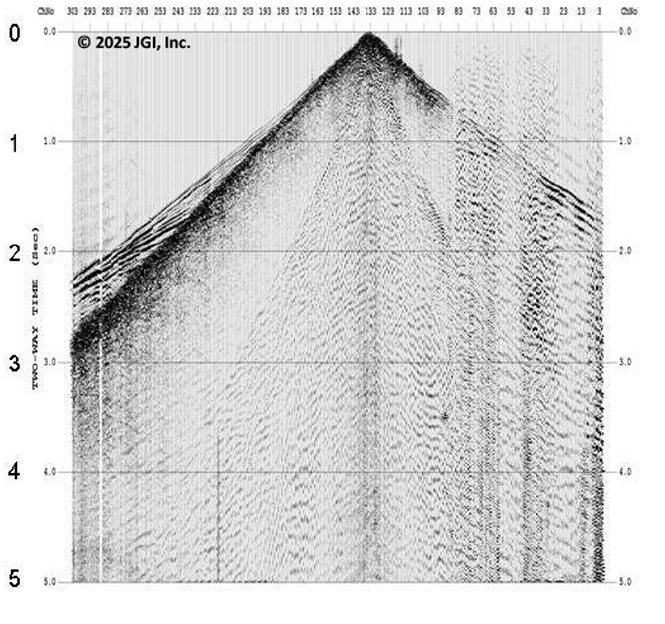
Reflections in the stacked section did not necessarily come from geological boundaries just below the recorded location but rather came obliquely in case of dipping boundaries. Imaging, or migration processing, is applied to map the reflected waves to the true location so actual subsurface structures can be correctly recognized.
Research and development efforts on processing methods have been being continued to reduce noise and enhance reflected waves more effectively, making it possible to create seismic images with higher signal-to-noise ratio (S/N ratio). We provide seismic images with high SN ratio by combining in-house software and external software.
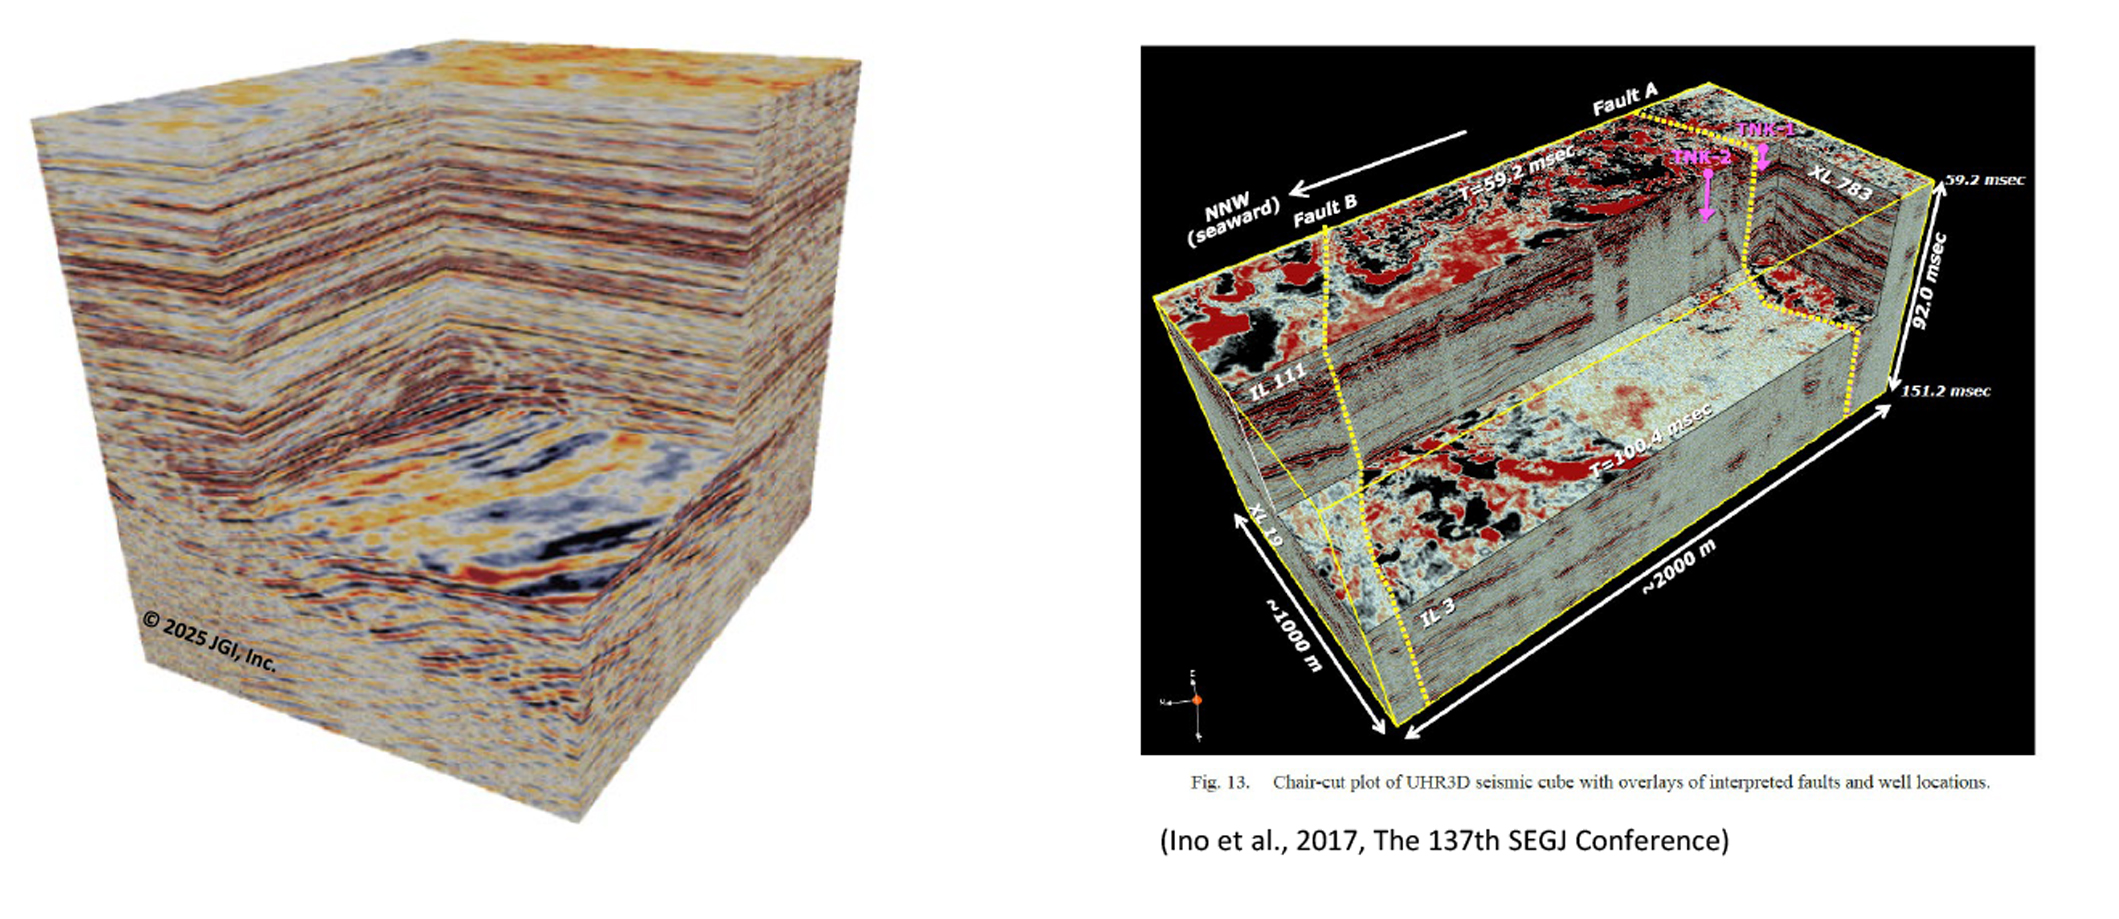
Three-dimensional seismic data processing
Although 3D seismic data processing does not differ significantly from 2D data processing in its basic steps, each step uses methods suitable for 3D data. Also, since the amount of data is large, large-scale computing systems (e.g., thousands of CPUs, petabytes of HDD) are involved. Two processing aspects where the advantages of three-dimensionality are demonstrated are listed below.
Noise suppression processing
Both signals and noise propagate three-dimensionally (in all directions) through the strata, but their propagation characteristics differ. This difference in propagation is utilized in noise suppression processing. Recording data three-dimensionally clarifies the distinction between signals and noise more effectively than two-dimensional recording, making it easier to separate them, thus enabling more effective noise suppression.
Imaging (migration) processing
Reflected waves arriving at surface receivers from a geological interface do not always come directly from below the receiver. Imaging or migration processing is essential to move the reflected waves captured by seismic surveys to their spatially correct positions. To accurately represent a certain point underground, migration processing that considers the three-dimensional wave propagation is performed using a large amount of data surrounding that point, thereby obtaining an accurate underground image.
(Teranishi, et al, 2021)
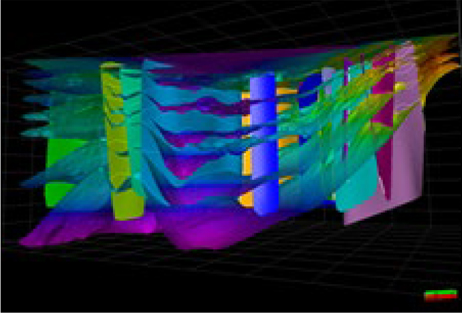
Modeled Fault Surfaces and Stratigraphic Boundaries
(Sawada et al., 2020,
The 3rd Technical Seminar
of the 3D Geological Technology
Analysis Consortium)
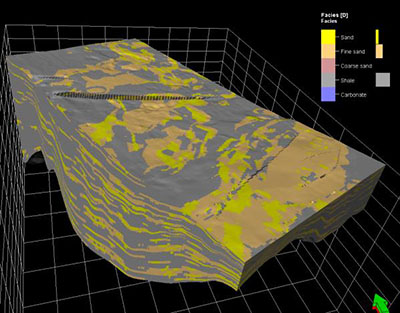
Example of modeling the distribution of sandstone, fine-grained sandstone, and mudstone based on the characteristics of reflected waves observed in seismic data, referencing the depositional patterns of meandering river systems.
Advanced Data Processing
In addition to basic data processing, special processing methods are available to further enhance reflected waves and visualize more detailed subsurface structures.
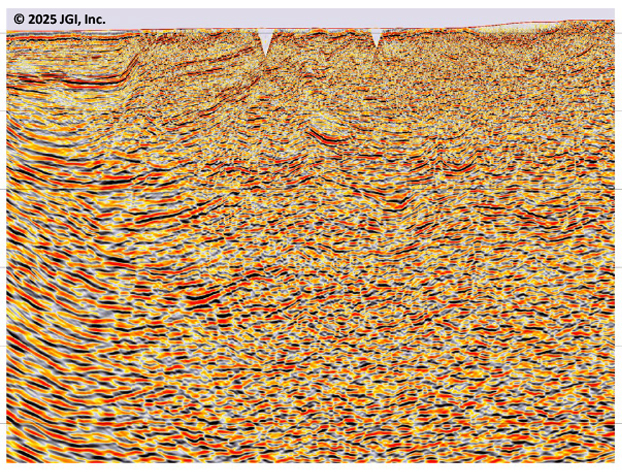
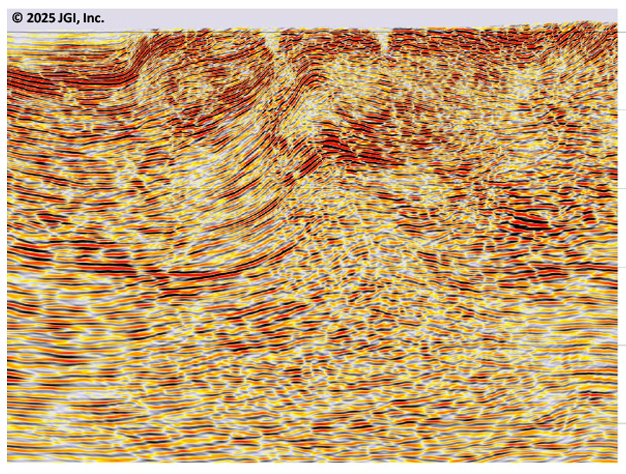
Multi-Dip Common Reflection Surface (MDRS) Processing
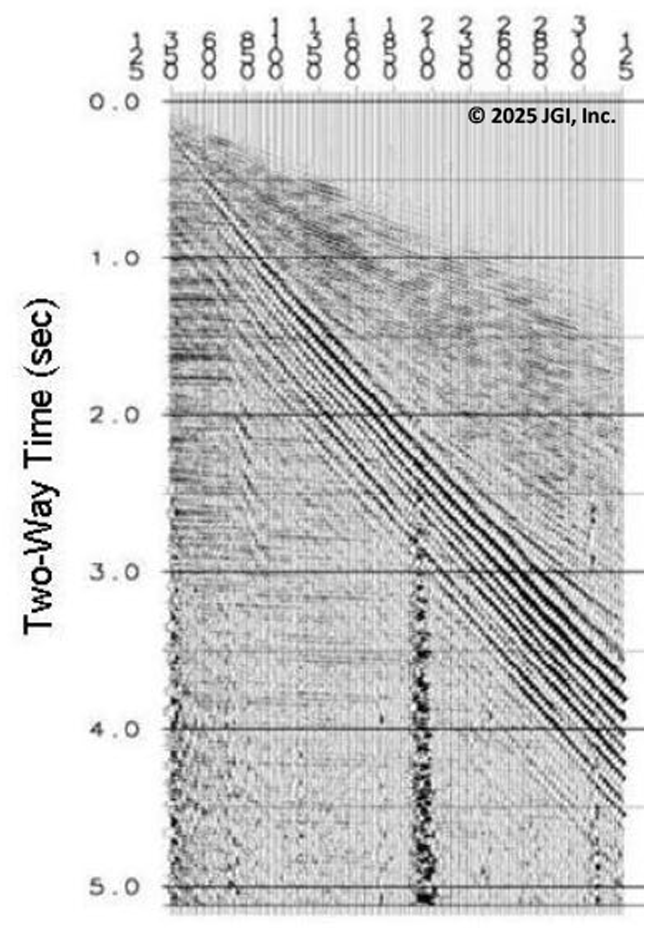
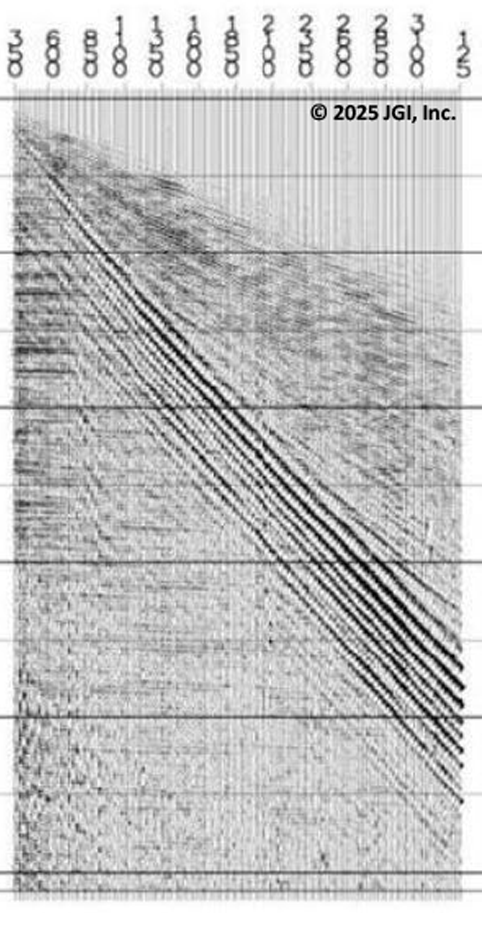
Multi-Dip Common Reflection Surface (MDRS) processing significantly improves the quality of seismic sections by selectively enhancing weak and unclear signals covered by noises.
Full waveform inversion (FWI)
Elastic wave velocity in geological layers is subusurface information that reflects the properties of rocks and fluids, and it is also an indispensable parameter for accurate data processing. By using Full-waveform Inversion (FWI), we can accurately capture complex velocity structures that are difficult to estimate with conventional methods.
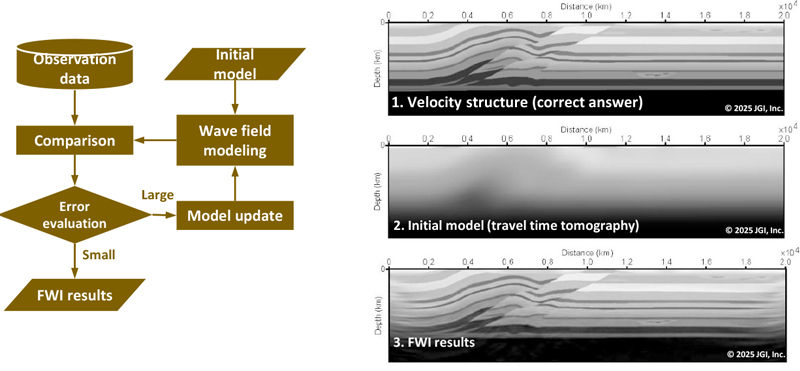
First, wave field modeling is performed using velocity structure (2 in the previous figure) estimated by travel time tomography as an initial model, and the results are compared with the observed data. Next, the model is updated so that the difference between them becomes small and wave field modeling is performed using the updated velocity model and compare the result with the observation again. This operation is repeated until the difference between the modeling result and observation becomes sufficiently small to generate the final FWI result (3 in the previous figure).
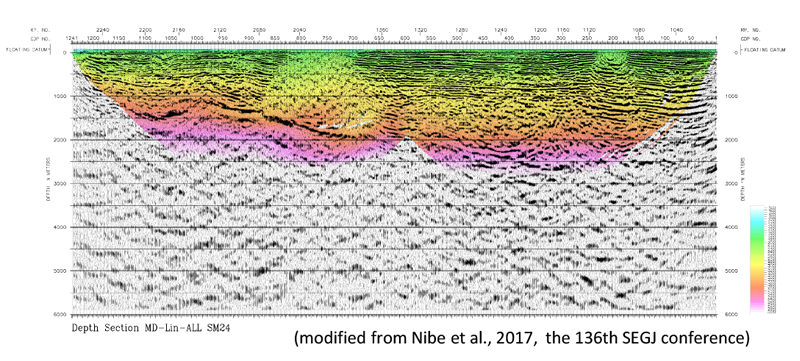
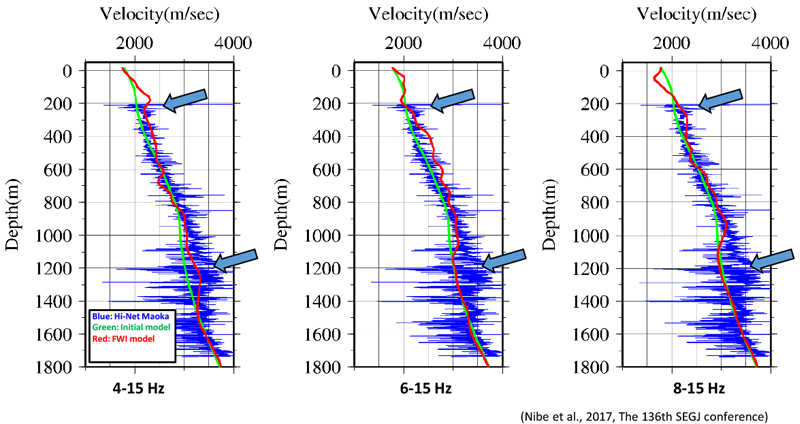
The results of FWI (red) using the velocity structure estimated by traveltime tomography (green) as the initial model, show that the FWI results approaches the trend of the well log (blue) as the input seismic data for FWI contain more low frequency components.
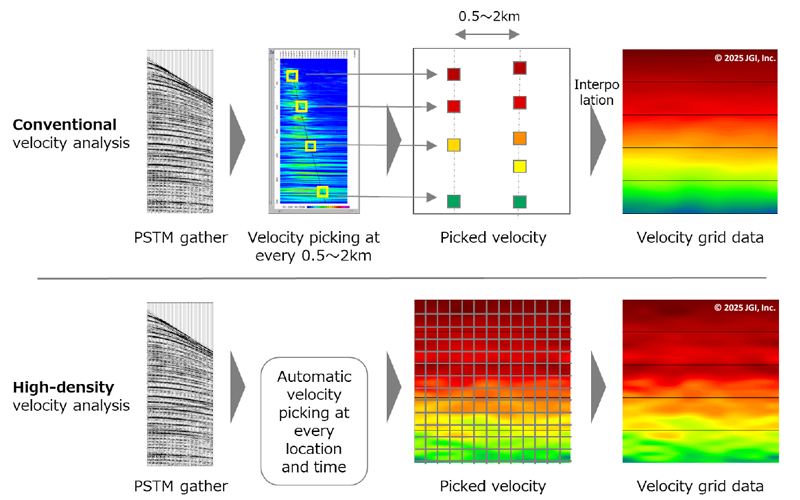
High-density velocity analysis
In conventional velocity analysis performed during basic data processing, a processor visually interprets velocity spectra at every 0.5-2.0 km along the survey line. In contrast, high-density velocity analysis automatically reads velocities at all data locations using a computer. The high-density velocity analysis enables to extract detailed velocity structures that vary both in vertical and lateral directions, providing information for estimating differences in rock types and pore fluids that constitute the geological layers.
Rock Physics Analysis
Acoustic Impedance Inversion
Acoustic impedance, the product of P-wave velocity and density, is crucial information for estimating rock porosity, lithofacies, and the type of fluid filling the pores in a formation. Acoustic impedance inversion is an analysis method that reconstructs the acoustic impedance structure from reflection seismic data and well data. We offer acoustic impedance inversion services using multiple methods, including model-based inversion and stochastic inversion
AVO(Amplitude Versus Offset) Analysis
AVO analysis, which evaluates in detail the incident angle dependency (Amplitude Versus Offset) of reflection coefficients at geological boundaries, can be used to estimate the properties of rocks constituting the upper and lower formations. For example, it is used to distinguish gas layers from strong amplitudes caused by various factors. Since the results of AVO analysis are not uniquely linked to subsurface conditions, evaluating the results requires referencing AVO modeling performed beforehand based on multiple geological scenarios. We provide comprehensive analysis services from seismic data preconditioning to AVO modeling and AVO analysis.
Pre-stack inversion (AVO inversion)
Pre-stack inversion, also known as AVO inversion, is an analysis method that estimates the subsurface acoustic (P-wave) and S-wave impedance structures based on the incident angle dependency of reflection coefficients, similar to AVO analysis. While AVO analysis extracts impedance contrasts at formation boundaries, AVO inversion reveals the impedance structure of the formations themselves. Our experienced engineers, who knows wave theory and rock physics, perform highly reliable AVO inversion.
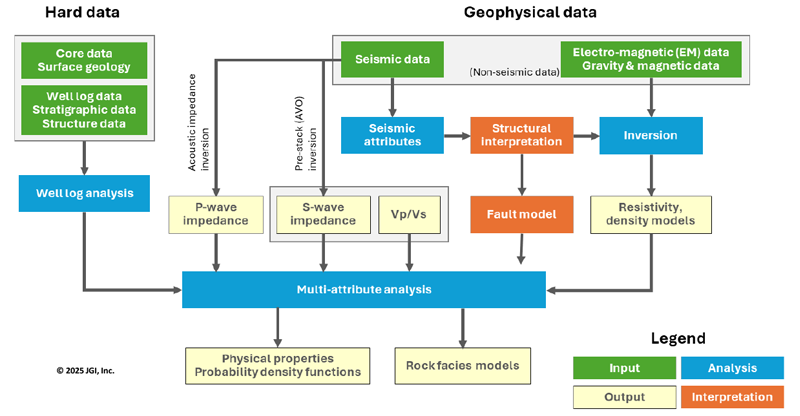
Construction of 3D subsurface structure model through integrated analysis of multiple geophysical exploration data
We construct subsurface structure models related to 3D structure, petrophysical properties, and (geo-) mechanical characteristics through integrated analysis using various geophysical exploration data, such as 3D reflection seismic data, well (logging) data, and non-seismic data (gravity, MT, magnetic, and electromagnetic). We support oil and natural gas exploration projects and development plans by constructing models related to lithofacies, fluid properties, porosity, and mechanical parameters