Latest Technical Service
Remote Sensing Technology Service Examples

2019 Ridgecrest, California, Earthquakes
Results of Differential Interferometric SAR (DInSAR) Analysis
Latest Technical Services
Remote Sensing Technology Service Examples
2019 Ridgecrest, California, Earthquakes
Results of Differential Interferometric SAR (DInSAR) Analysis
This page presents the results of differential interferometric SAR processing using SAR data from the Sentinel-1 satellite operated by the ESA, observed before and after the earthquakes that struck California on July 4 (17:33 UTC) and July 6 (03:19 UTC), 2019.
(1) Differential Interferogram (Ascending Orbit)
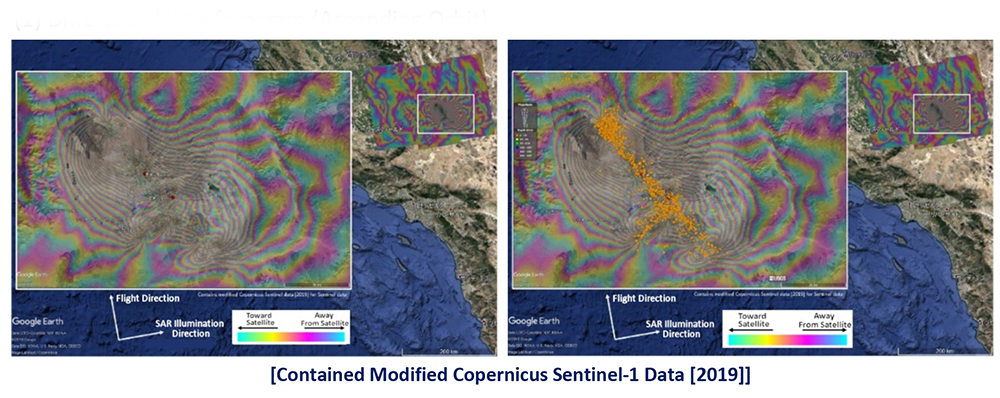
The upper figure shows the results of differential interferometric SAR processing using Sentinel-1 C-band SAR data acquired on July 4 and July 10, 2019. The satellite observed from an ascending orbit (flying south to north and imaging west to east). The left figure displays the phase of differential interferogram, with the epicenters of the two earthquakes indicated by red circles(◎). The right figure shows the aftershock distribution (from USGS) overlaid on the left figure. Sentinel-1 SAR data is C-band (wavelength = 5.6 cm), where one phase cycle corresponds to 2.8 cm of surface displacement in the satellite’s line-of-sight direction. An increase in phase indicates movement away from the satellite. The phase pattern suggests the presence of a fault striking northwest?southeast. On the southwestern block of the fault, movement toward the satellite is observed, with a maximum displacement of about 75 cm near the northern end of the fault. On the northeastern block, movement away from the satellite is observed, with a maximum displacement of about 60 cm near the central part of the fault. In addition, another fault with a northeast?southwest strike, intersecting the main fault, is considered to exist.
(2) Differential Interferogram (Descending Orbit)
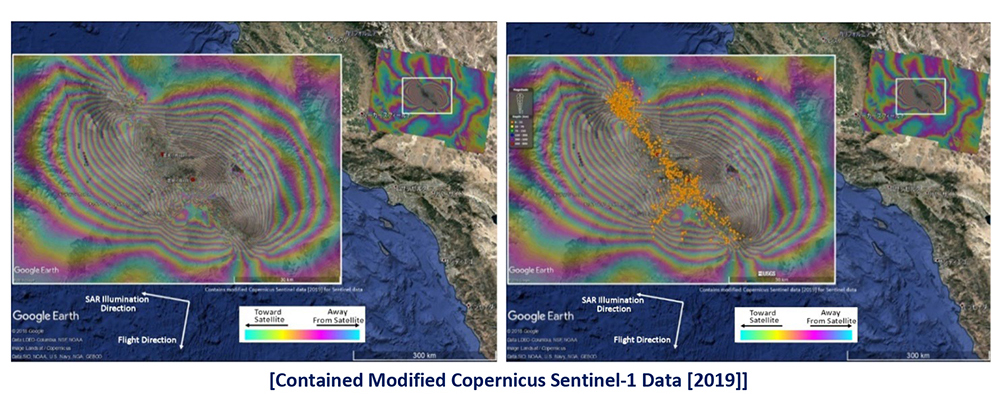
The upper figure shows the results using data acquired on July 4 and July 16, 2019, from a descending orbit (satellite flying north to south, imaging east to west). The left figure shows the phase of differential interferogram, with the two epicenters indicated by red circles, and the right figure shows the aftershock distribution from USGS. Similar to the ascending orbit results, the phase pattern indicates a northwest-southeast trending fault. On the southwestern block, movement away from the satellite is observed, reaching about 60 cm near the northern end. On the northeastern block, movement toward the satellite is observed, with maximum displacement of about 105 cm near the central part of the fault. Note: These results are preliminary and have not been corrected for atmospheric delay or other effects.
(3) 3D Surface Displacement Distribution
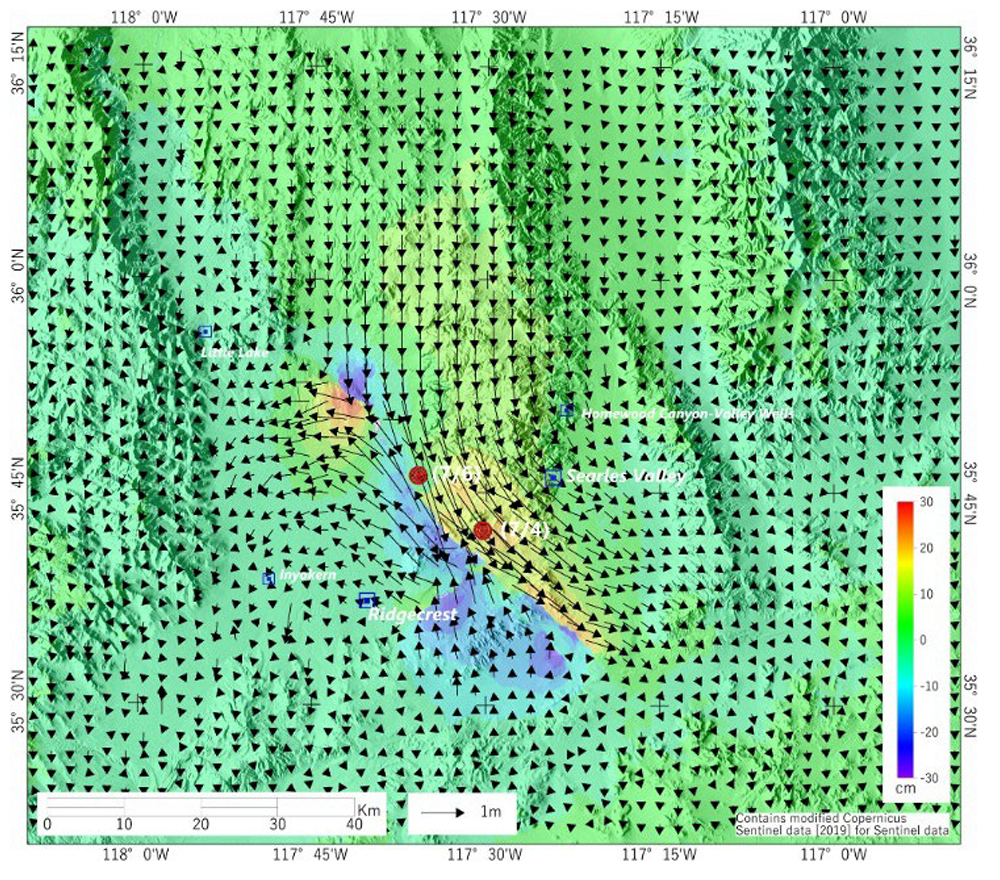
Using data from both the ascending orbit (July 4 and July 10, 2019) and the descending orbit (July 4 and July 16, 2019), 3D surface displacement was calculated. Horizontal displacements (east-west and north-south) are shown as vectors, and vertical displacements as a color map. Red circles mark the epicenters of the foreshock (July 4) and mainshock (July 6). The results again suggest the presence of a northwest-southeast striking fault. The horizontal displacement distribution shows counterclockwise rotation across the fault, indicating right-lateral strike-slip activity. Maximum horizontal displacements reach about 2.0 m northwestward on the southwestern block, and about 2.3 m southwestward on the northeastern block. The vertical displacement distribution appears to be divided into four zones: uplift in the northern part of the southwestern block and the southern part of the northeastern block, and subsidence in the southern part of the southwestern block and the northern part of the northeastern block. Maximum vertical displacement reaches about 30 cm for both uplift and subsidence. (*These results were presented at the 2019 Autumn Meeting of the Japan Society for Active Fault Studies.)