Geophysical Exploration Data Acquisition Service
Table of Contents
What is Geophysical Exploration?
Geophysical exploration is a survey method that uses physical techniques to indirectly determine the subsurface geological structures, the material properties and conditions, which are difficult to observe directly. Depending on the physical quantity used, there are exploration methods such as seismic, electric, magnetic, electromagnetic and gravity surveys. Compared to other exploration methods, the seismic exploration method using elastic waves is widely used from the exploration stage through the development and production stage in oil and gas development. This method is also applied to earthquake disaster prevention surveys and academic surveys to understand the subsurface geological structures of target areas, from shallow to deep. Furthermore, high-resolution seismic exploration data also contributes to the high-precision visualization of the seabed foundation in surveys for projects such as offshore wind farm development.
Seismic Reflection Survey
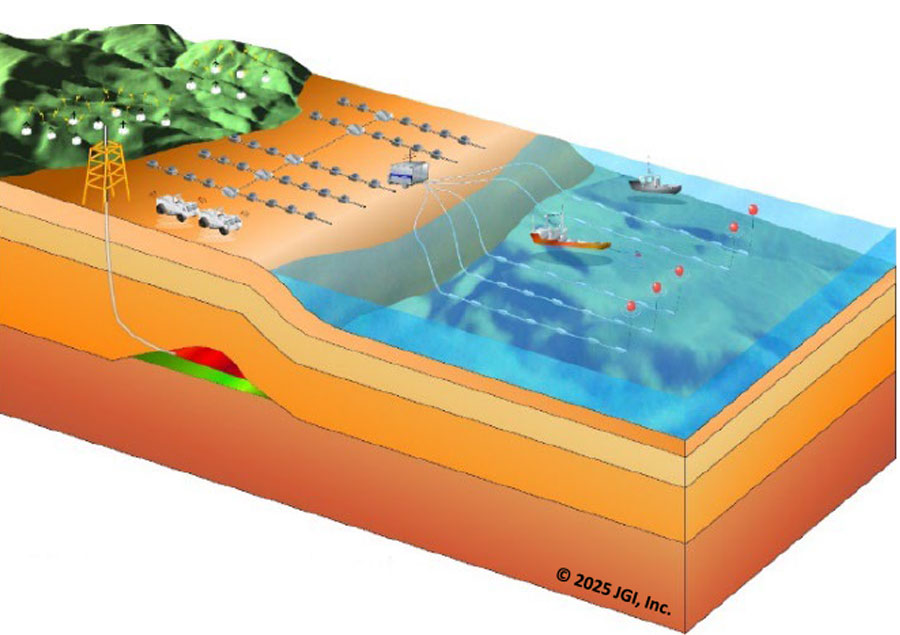
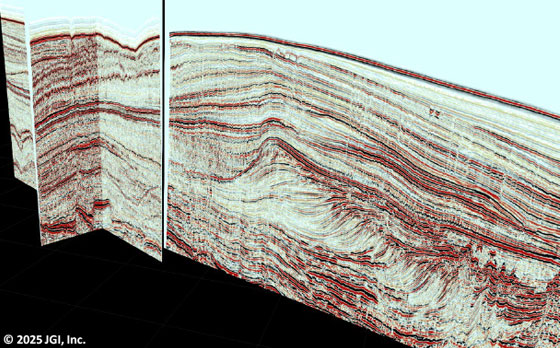
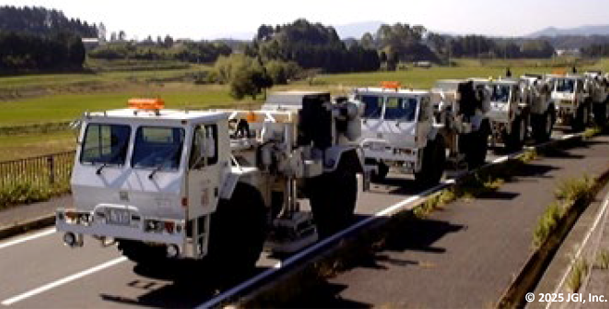
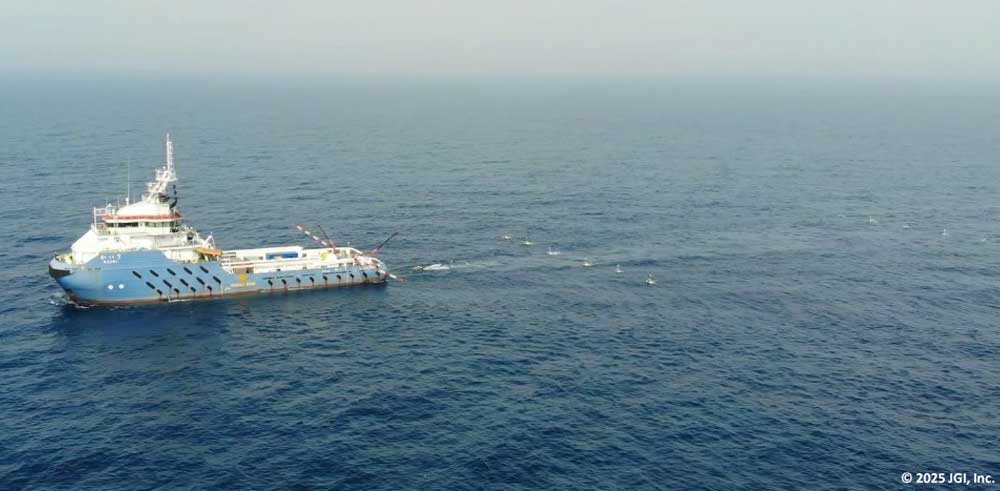
A seismic reflection survey is one of the non-destructive visualization methods for subsurface structures. Weak seismic waves (elastic waves) generated at the surface propagate downwards and reflect at the geological boundaries, across which the seismic velocity and density of the rocks change. The reflected waves propagate upward to the surface and detected by receivers (seismometers) located on the surface. By processing and analyzing the recorded reflection data, the subsurface structure can be visualized. The arrival time and amplitude of the captured reflected waves reveal the subsurface velocity structure, geological structural morphology, and the properties of the rocks and fluids that make up the strata. The obtained subsurface information is used for hydrocarbon exploration, site evaluation and storage monitoring for CCS (Carbon Capture and Storage) projects. To acquire seismic data in various surface environments, different types of sources and receivers are used. Dynamite, large and medium-sized vibrators, and airguns are typically used as sources, while geophones (1-component, 3-component), hydrophones, towed receiver cables (streamers), and ocean bottom cables (OBC ) or nodes (OBS), are available as receivers. While a single pair of the source and receiver is usually selected, several sources and/or receivers are sometimes combined for complicated surface environment of the site such as tidal zones or hilly areas. In land terrestrial areas, large-scale 3D surveys are conducted using large vibrators and over 3,000 receiver channels. In marine areas, offshore 3D surveys are performed with air gun sources and streamer cables. In the land-sea transition zones, various source and receiver systems are integrated to achieve seamless 3D seismic data.
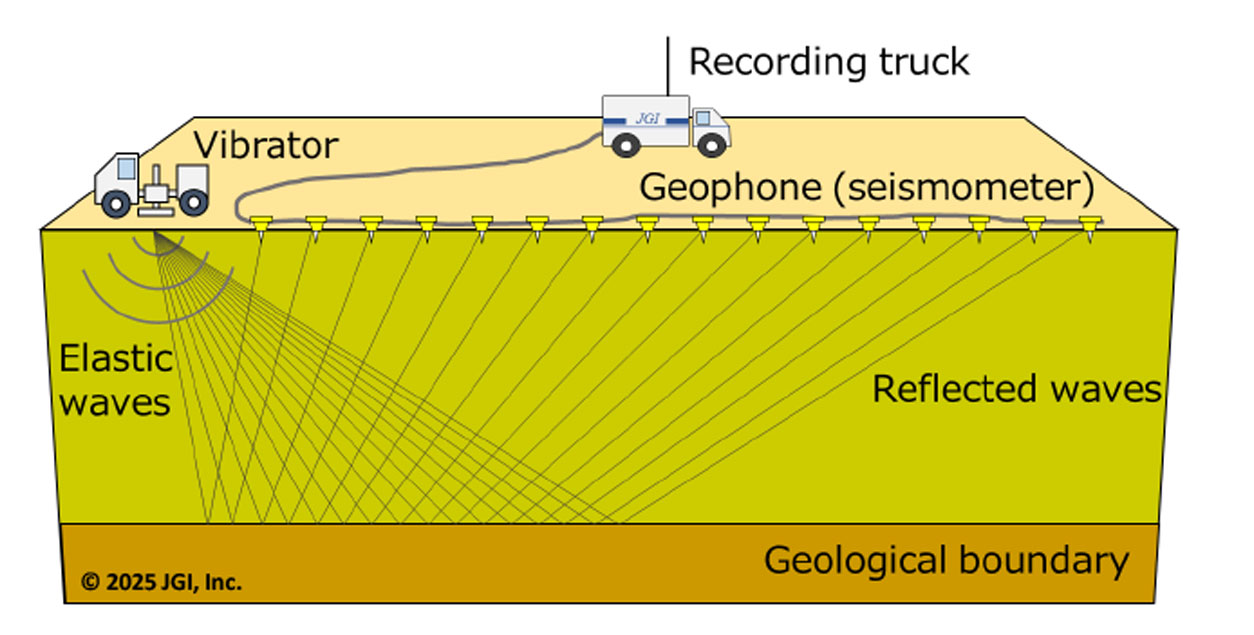
Schematic of seismic reflection data acquisition (onshore 2D)
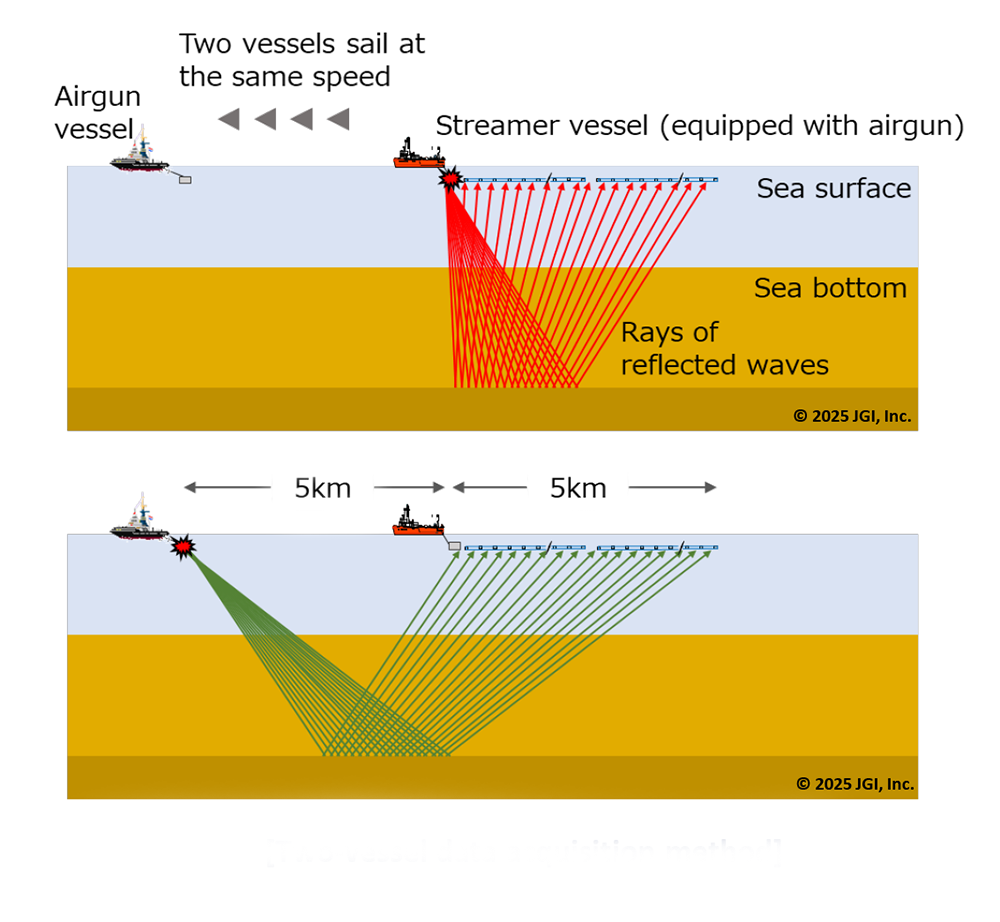
For positioning, RTK-GPS (Real Time Kinematic GPS) systems are used in land areas. In marine areas, a proprietary wireless navigation system using DGPS (Differential GPS) is employed to measure vessel positions. As an application, two vessels, a source vessel and streamer vessel, each equipped with DGPS, are operated simultaneously to virtually implement long source-receiver offsets for a deep exploration or collecting refraction data. Although S-wave is a very useful for both imaging geological structures and predicting subsurface lithology because of its insensitivity to fluids saturated in the rocks, it is difficult to measure especially in marine environments since S-wave does not propagate in the water. For S-wave exploration, we provide 3-component data acquisition with OBC or OBN deployed on the seafloor to record P-S converted waves.
![[Independent receiver system]](https://jgi-inc.com/en/wp-content/themes/originaltheme/asset/img/technology/geophysical-data/receiving-system.jpg)
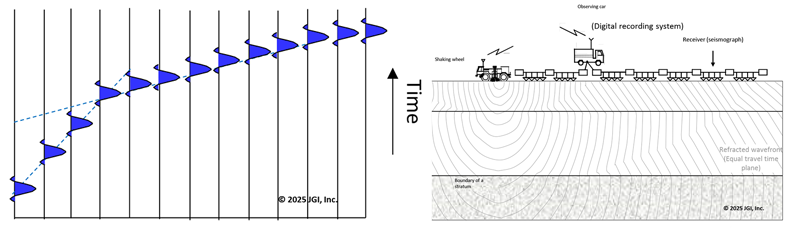
Seismic Refraction Survey
Refraction seismic surveying is a method used to estimate geological structures by utilizing waves (elastic waves) that travel through the ground, refract at the interfaces between geological layers, propagate along these interfaces, and return to the surface. When the elastic wave velocity in the lower layer is higher than that in the upper layer across a layer boundary, the refracted waves from that boundary arrive first at receiver points located beyond a certain distance. In refraction seismic surveying, the arrival times of these first-detected waves (first arrivals) are read from the observed records to determine the subsurface velocity distribution and the depth of the interfaces. Analytical methods include approaches that assume a multi-layered structure, determining the velocity distribution and interface depth for each layer sequentially from shallow to deep layers (e.g., the “intercept method” or the “time-term method”), as well as methods that solve for a continuous velocity distribution as an inverse problem without assuming discrete layers (travel-time tomography). In addition, refraction survey records can also be used in Full-Waveform Inversion (FWI) analyses, which utilize the waveform information, including later-arriving waves.
The results of refraction seismic surveys are used not only for geological interpretation in the form of velocity distribution maps (or boundary structure maps) but also as initial velocity models for depth imaging in reflection surveys, facilitating integrated analysis of reflection and refraction methods. Our company provides a wide range of services tailored to the survey target, from small-scale two-dimensional surveys using small sources (such as hydraulic impactors) to two- or three-dimensional integrated reflection and refraction seismic surveys utilizing large sources (vibrators, high-charge blasting, air guns) and multi-channel recording systems.
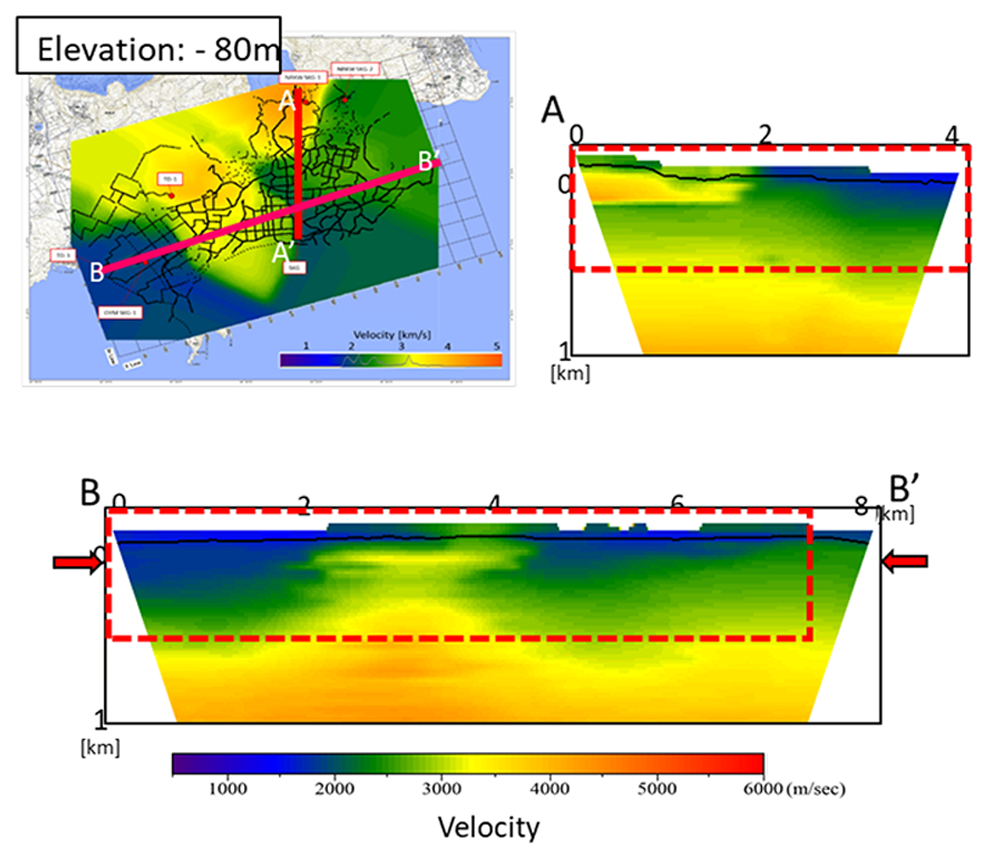
(modified from Aoki et al., 2016, the 134th SEGJ conference)
Correspondence with the distribution of volcanic rocks was proven from comparison with boring information.
Randomized initial model tomography
In our refraction tomography analysis, we employ a Monte Carlo-based reliability assessment method (Shiraishi et al., 2010) to quantitatively evaluate the dependence on the initial model. Under certain conditions, tomography analyses are performed on a large number of initial models generated randomly, and the results are averaged to obtain a velocity distribution. We also calculate the standard deviation distribution, which indicates deviations from the mean. This approach provides an objective velocity distribution that eliminates arbitrariness in the initial model setting, as well as the spatial distribution of the dependence of velocity estimates on the initial model.
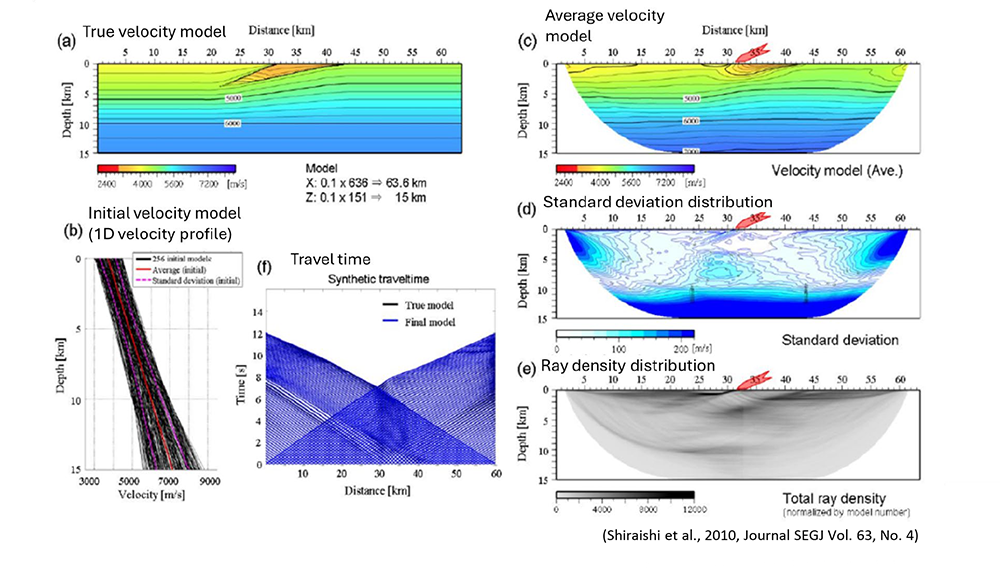
(a) True model, (b) All 1D velocity profiles used as initial models. (c) Average of estimates from each initial model (average velocity model), (d) Standard deviation distribution, (e) Ray density. (f) Comparison of theoretical traveltime and observed traveltime for the final model.
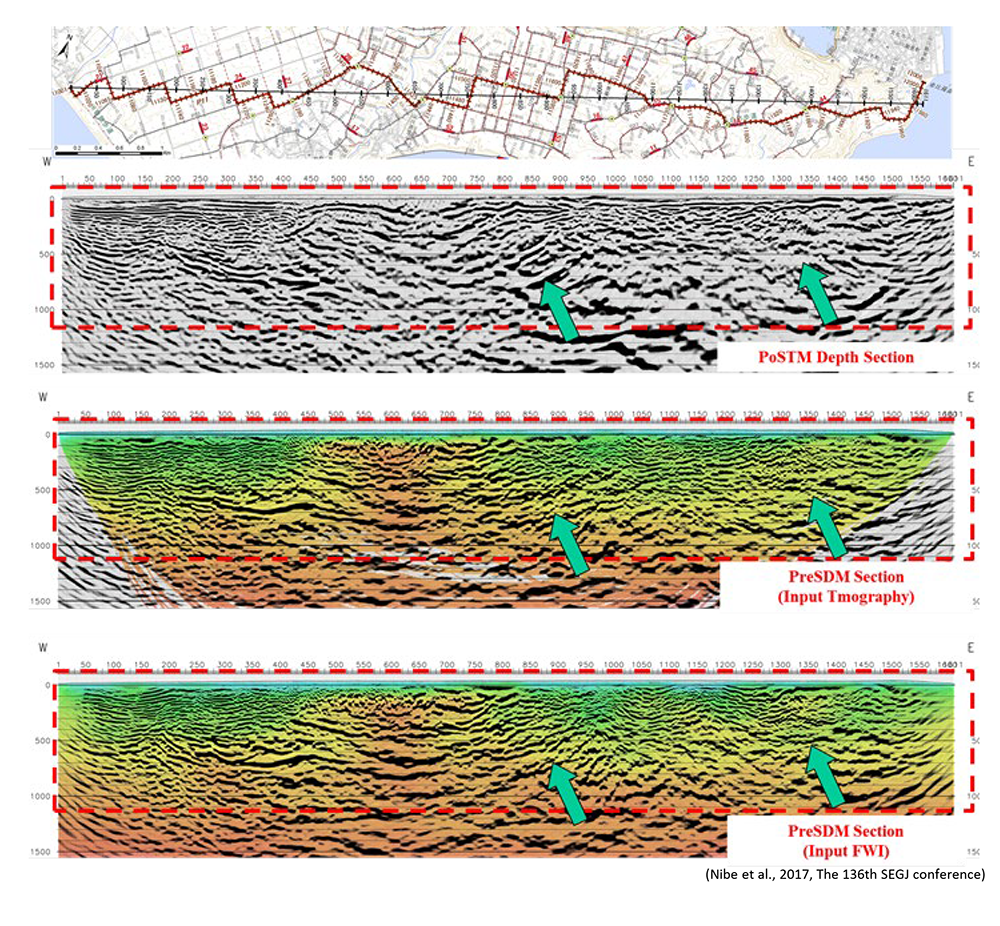
Comprehensive support for FWI analysis
We offer a Full-Waveform Inversion (FWI) service that derives high-resolution subsurface property distributions from refraction survey data by using the waveform information itself, including later arrivals. FWI generally requires not only long-offset records containing low-frequency components but also a highly accurate initial model. Our company provides comprehensive support for building precise velocity models, including waveform data acquisition using broadband vibrators and the provision of initial velocity models through randomized tomographic inversion.
Gravity and Magnetic Surveys
The gravity varies with density of the rocks in the subsurface. Generally, igneous rocks have larger densities than sedimentary rocks, and even within sedimentary rocks, density increases with burial depth as porosity in the rock decreases with depth. Gravity exploration takes advantages of the density variation with lithology, porosity and pore fluids. In the gravity exploration, a relative gravimeter is used to take measurements at points distributed along a survey line or over a target area. Since the measured gravity is affected by various causes such as elevation and surrounding material, appropriate corrections are applied to remove those effects and to calculate gravity anomaly caused only by subsurface material and structure. We use relative gravimeters to perform gravity measurements not only on land but also offshore and on the seafloor. We contribute to the energy sector, academic research, and others through various analyses on gravity data.
The Earth’s magnetic field changes with variations in the magnetic susceptibility and remanent magnetization of underground rocks. Igneous rocks containing magnetite, for example, have higher magnetic susceptibility than sedimentary rocks or carbonate rocks. Magnetic exploration utilizes this difference in magnetic susceptibility to estimate underground structures. Magnetic field measurements, using proton magnetometers and other instruments, can cover wide areas on land and at sea with aircraft, helicopters, or vessels. It is often used in conjunction with gravity exploration for underground structure assessments for large areas for the purposes such as resource exploration and disaster prevention.
![[Concept diagram of Gravity and Magnetic Anomalies]](https://jgi-inc.com/en/wp-content/themes/originaltheme/asset/img/technology/geophysical-data/abnormal-gravity.png)
Gravity and magnetic anomalies are interpreted after various types of filtering, including vertical/horizontal derivative, shape index, etc. to extract basement structures, fold structures, latent faults, caldera structures, and metal deposits. Quantitative structural analysis can also be performed by forward modeling and inversion approaches. In addition, improved accuracy is expected in estimating subsurface structure by integration both of gravity and magnetic analyses.
●An example of subsurface structure analysis based on gravity anomaly
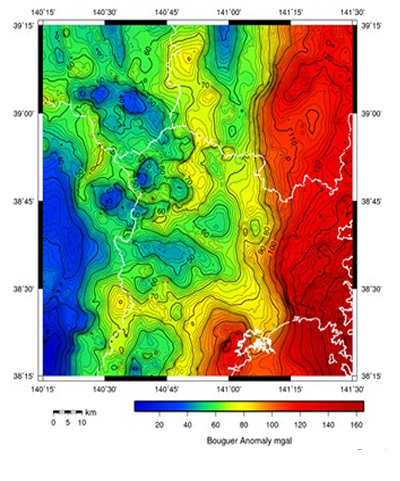
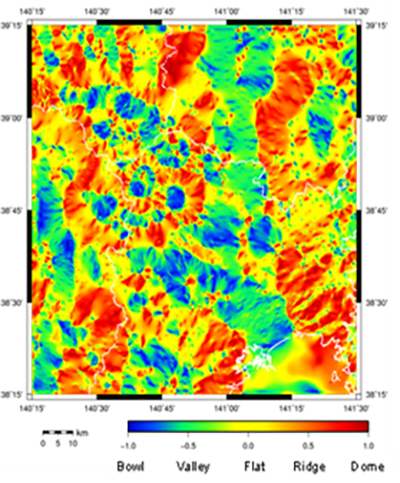
Created from Japan Gravity CD-ROM 2nd edition (GSJ/AIST, 2004)
● Integrated analysis based on gravity and magnetic anomaly
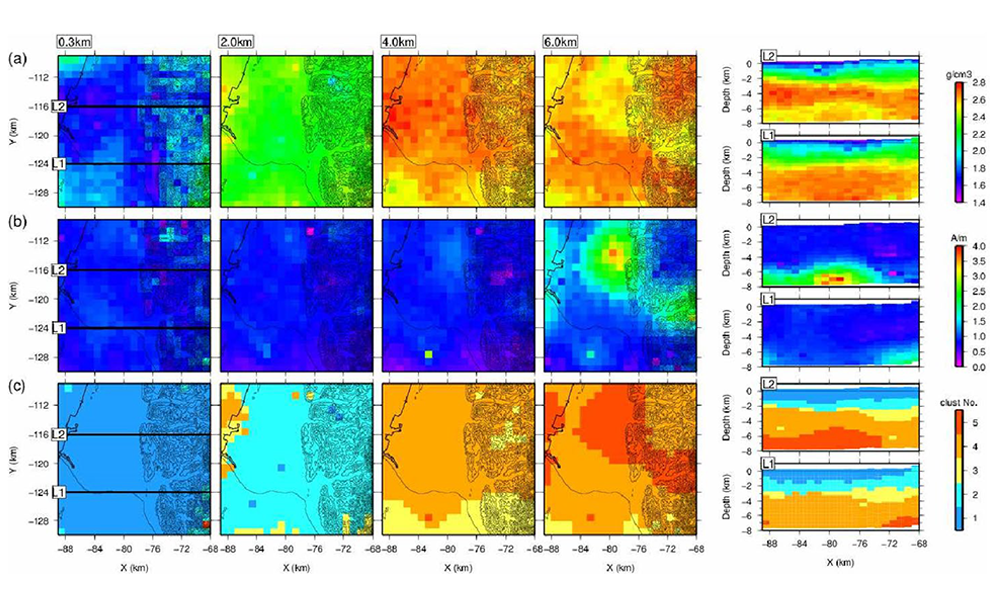
(Nakayama et al., 2021, The 145th SEGJ conference)
By 3D gravity-magnetic joint clustering inversion, (a) density distribution, (b) magnetization intensity distribution, and (c) cluster distribution (the left side is a plan view, the number on the top is depth. The right side is a cross-sectional view, and the position is shown in the leftmost plan view).
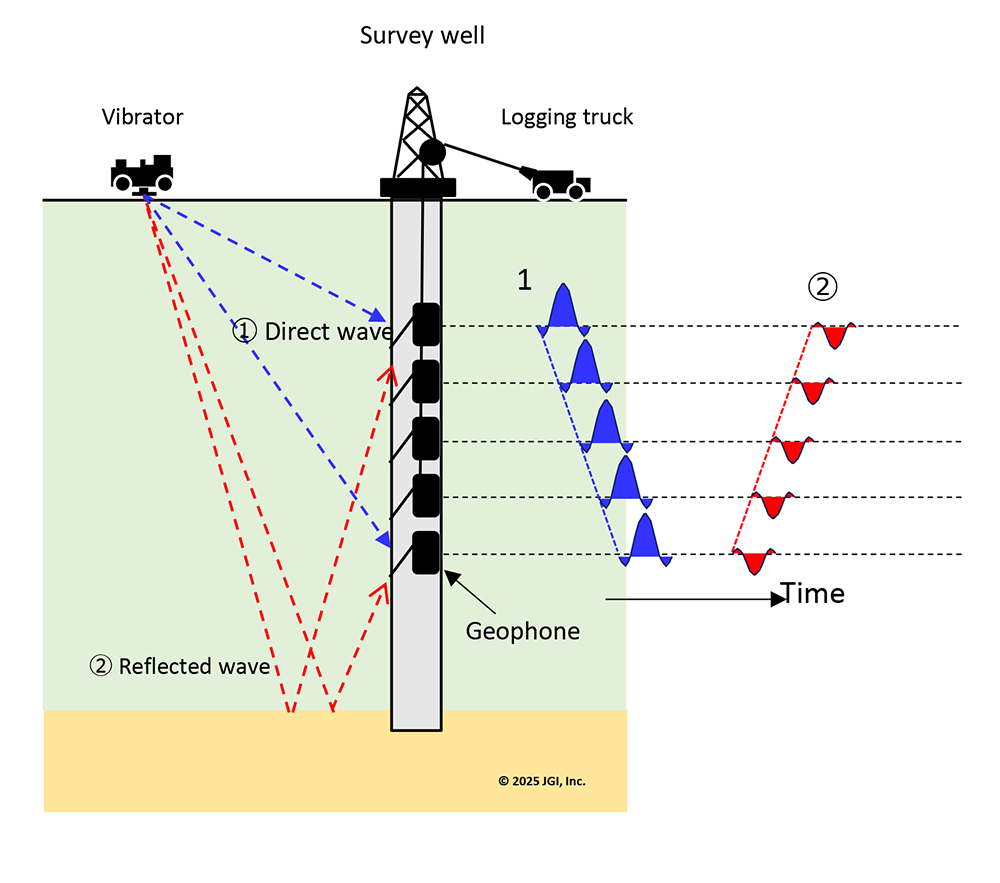
VSP method
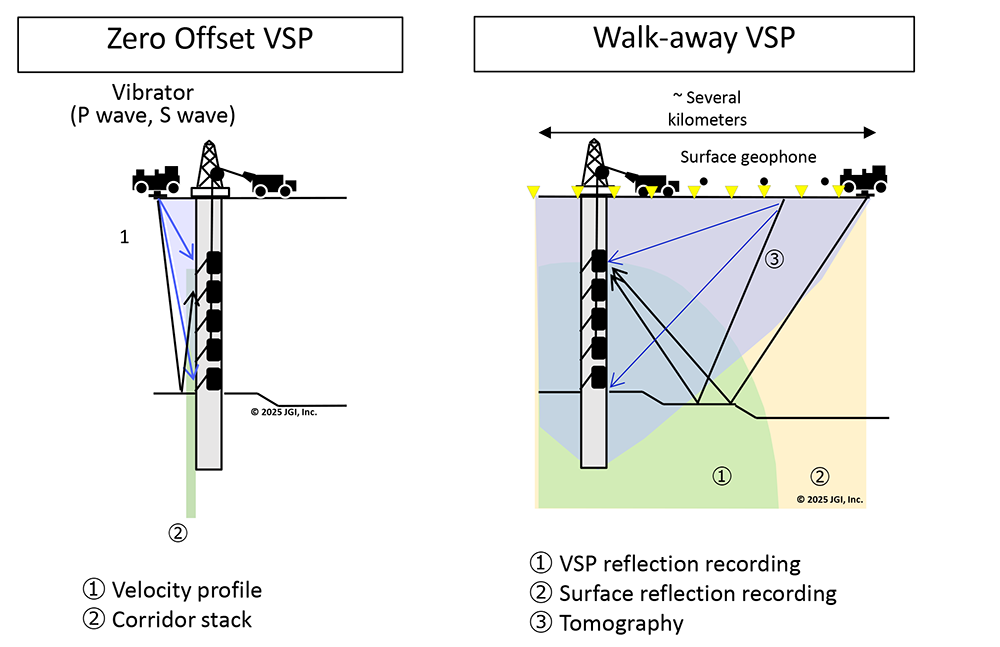
Vertical Seismic Profiling (VSP) is a seismic survey method in which elastic waves generated at the surface are recorded using receivers placed at multiple depths within a borehole. On land, vibrators are commonly used as seismic sources, while at sea, air guns are typically employed. For receivers, three-component geophones are often used. A specially packaged tool is lowered into the borehole to enable high-precision measurements, and data are acquired by pressing the receivers against the borehole wall using arms or similar mechanisms.
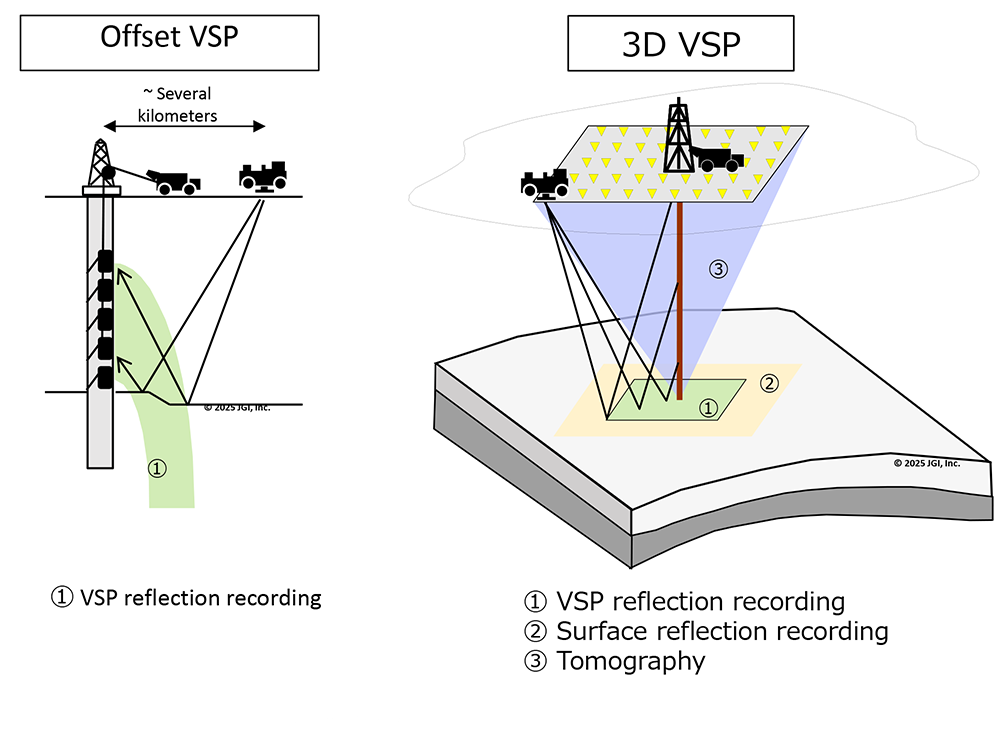
VSPs are classified into several types depending on the offset distance from the borehole source location and the method of source deployment. A VSP survey in which the source is activated near the wellhead is called a zero-offset VSP. From the first arrivals of the direct waves, the relationship between time and depth as well as the velocity structure along the borehole can be obtained. In addition, reflection records along the borehole, known as corridor stacks, are useful for comparison with surface reflection surveys. Offset VSP surveys, in which the source is activated at a location horizontally offset from the well, are used to create reflection records near the borehole. Furthermore, walkaway VSPs, where the source is moved while acquiring data, and 3D VSPs, which acquire three-dimensional data, provide the velocity structure near the borehole through tomographic analysis in addition to reflection records. In these surveys, placing receivers on the surface as well enables a broader understanding of the structure through surface reflection records.
In VSP surveys, deploying a large number of observation points within the well enables more detailed imaging of the reservoir. To improve data acquisition efficiency, multiple geophones are often connected in series. However, since high-precision sensors are expensive, hydrophone cables-which allow multi-point observation at lower cost-are frequently used, and in recent years, the use of DAS *1, which can measure the entire well section with a single shot, has also been increasing. In particular, VSP surveys using DAS allow for three-dimensional source point arrangements and relatively low-cost observations across multiple wells, making them promising for high-resolution 3D surveys near wells.
*1: Distributed Acoustic Sensing, a sensor system that can capture vibration and sound with optical fibers
Learn more
Land and Offshore Survey Services
JGI provides surveying services in compliance with public surveying quality standards, including leveling, triangulation, trilateration, and GNSS(Global Navigation Satellite System) surveys.
Land Seismic Surveys
Surveyors mark the receiver positions using wooden stakes, pin flags, or similar markers. The layout crew then places the receivers as close as possible to the marked locations. Receiver positions are accurately surveyed using CLASandRTK-enabledGNSS or total station methods. Once the receivers have been deployed, source operations are carried out in accordance with survey design. Source Points are also accurately surveyed using JGI’s proprietary GNSS navigation system mounted on a source truck.
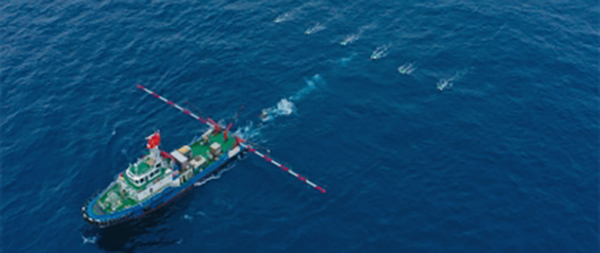
Marine Seismic Surveys
JGI employs integrated navigation systems, such as “ORCA” for 3D marine seismic surveys and “CHIPS” for 2D surveys, in conjunction with CLASand RTK-enabled GNSS receivers and acoustic positioning devices to navigate and monitor seismic vessels and towing equipment. (e.g., Streamer Cables, Airguns, Ocean Bottom Nodes and Cables).
After completing field survey work both on land and offshore, JGI can provide survey results in specified formats, prepare plan and as-built drawings, and develop databases using GIS.
JGI participates in and supports various academic societies and organizations, including the Geodetic Society of Japan, the Japan Hydrographic Association, the Association of Surveyors, and the Society of Exploration Geophysicists of Japan, to stay abreast of the latest trends in survey technologies and incorporate them into its service offerings.
![[Land surveying by Total Station]](https://jgi-inc.com/en/wp-content/themes/originaltheme/asset/img/technology/other-services/total-station.jpg)
![[Land surveying by RTK-GNSS]](https://jgi-inc.com/en/wp-content/themes/originaltheme/asset/img/technology/other-services/rtk-gps.jpg)
Navigation Support System (Marine 2D Seismic Survey)
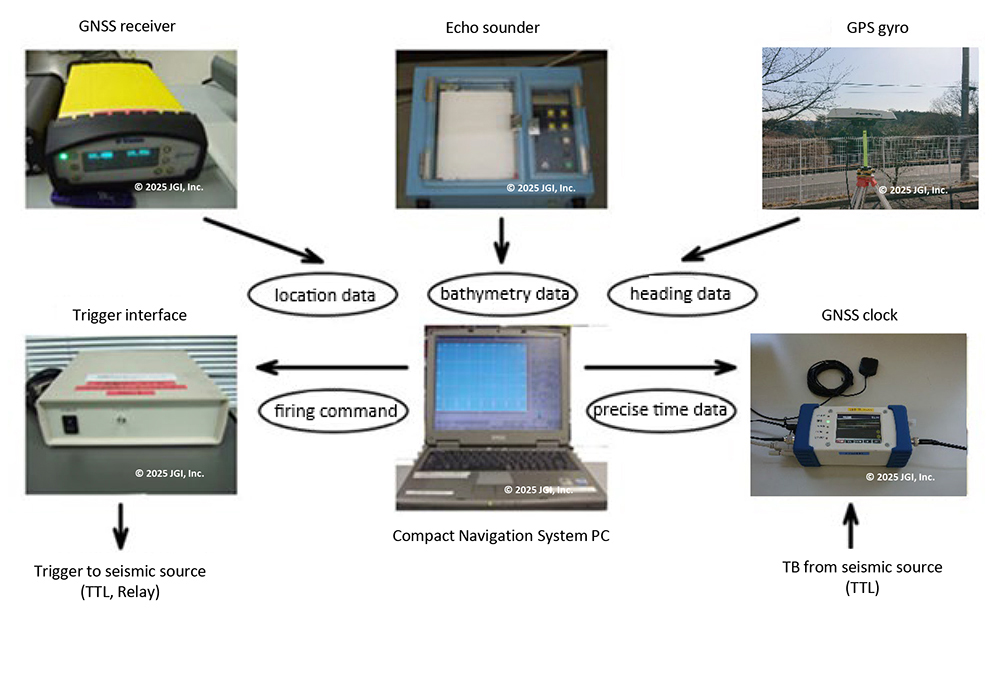
JGI is equipped with a compact navigation system called “ CHIPS System” for marine 2D seismic operations, which is used to navigate and monitor seismic vessels and towing equipment. As illustrated below, it acquires information from peripheral devices such as GNSS receivers, compass sensors, and echo sounders to follow planned survey lines at a specified speed and to control seismic source firing timing while recording positions and shot time.
Navigational Support System (Marine 3D Seismic Survey)
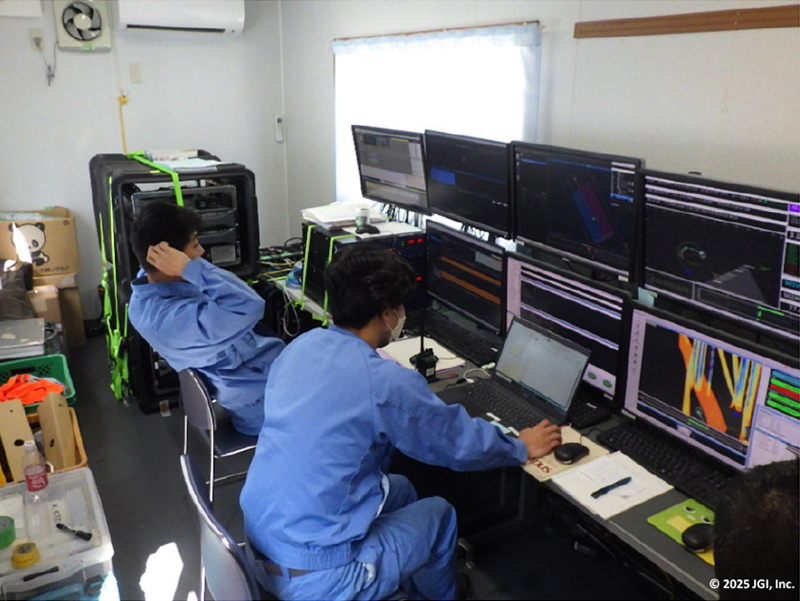
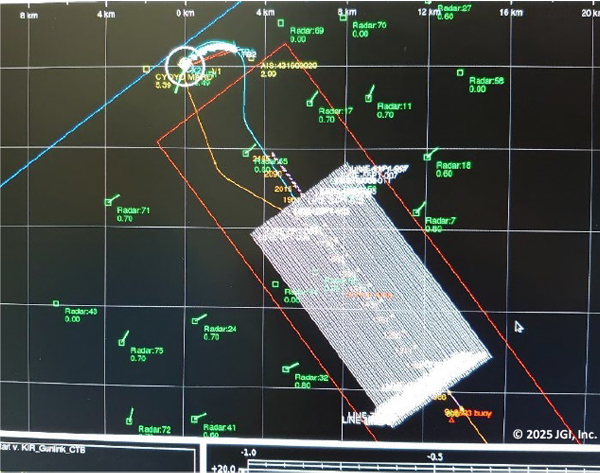
JGI is equipped with “Concept Systems made ORCA” for marine 3D seismic operations, which is used to navigate and monitor Seismic vessels and towing equipment. It acquires information from peripheral devices such as vessel’s position and heading direction, water depth, radar readings, acoustic positioning equipment mounted on towed streamer cables to follow a planned course at a specified speed and to control seismic source firing timing while recording positions and shot time.
“ORCA”】
acoustic positioning systems
attached to the streamer cable】
Acoustic positioning system
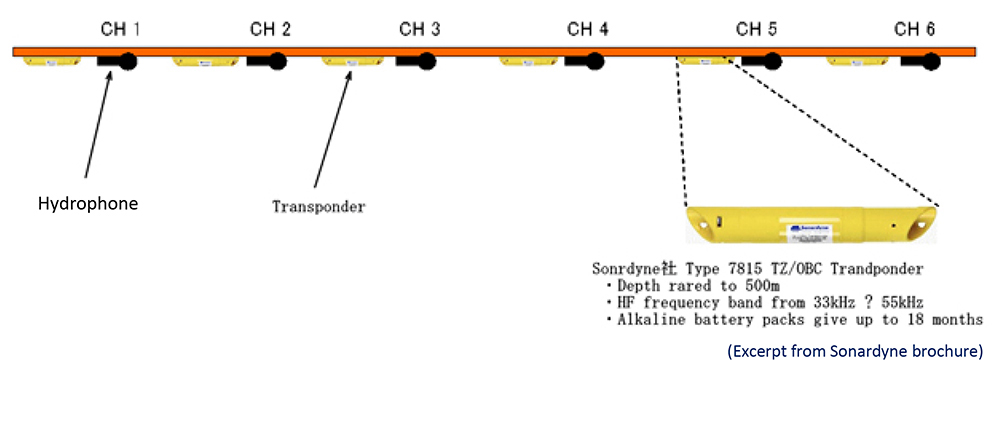
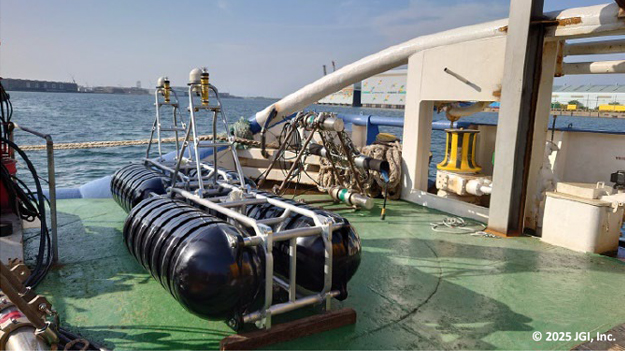
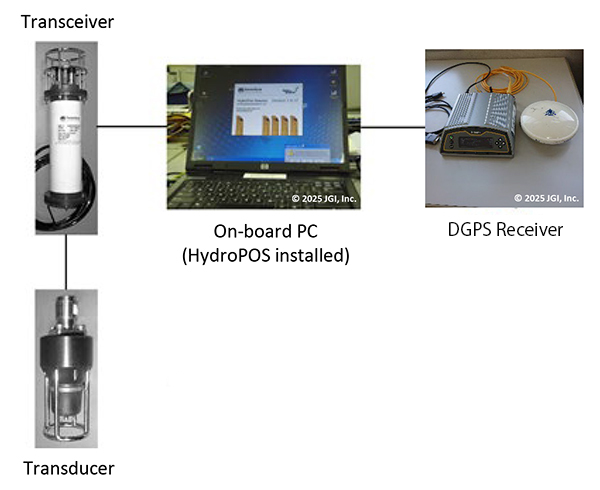
JGI is equipped with the TZ/OBC acoustic positioning system manufactured by Sonardyne Co., Ltd. The system consists of a PC running HydroPos software, a USBL transceiver and transducer, hundreds of transponders attached to OBN (Ocean Bottom Node) ropes and OBC (Ocean Bottom Cable). Once the OBN and OBC are deployed on the seabed, the system precisely measures the positions of each transponders.
The configuration of the on-board equipment for the acoustic positioning system is depicted in the figure to the right. The acoustic positioning observation software (HydroPOS) measures the acoustic range (distance) between the transducer, installed underwater on the hull of a pinging vessel, and each transponder deployed on the seabed, while the pinging vessel sails around the transponders. Based on this data, the system calculates the high-precision position of each transponder. The position measurement using the ranging method is more accurate than traditional first-break techniques, with an expected accuracy of 1-2 m, and can be conducted either during node or cable deployment operations or later while shooting.
Transponder devices are installed at regular intervals (approximately every three channels) on the OBC or Nodes. The example in the figure below shows transponders installed on each channel.