Latest Technical Service
Remote Sensing Technology Service Examples

2008 Sichuan earthquake
-Surface Displacement along the Longmenshan Fault Zone-
Differential Interferometric SAR (DInSAR) Analysis
Latest Technical Services
Remote Sensing Technology Service Examples
2008 Sichuan earthquake
-Surface Displacement along the Longmenshan Fault Zone-
Differential Interferometric SAR (DInSAR) Analysis
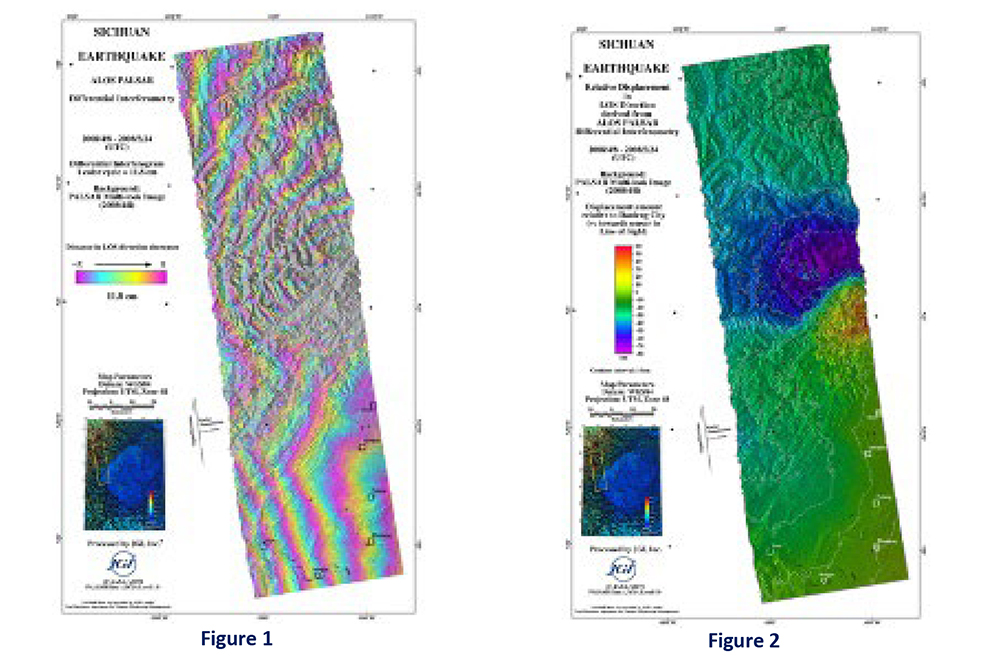
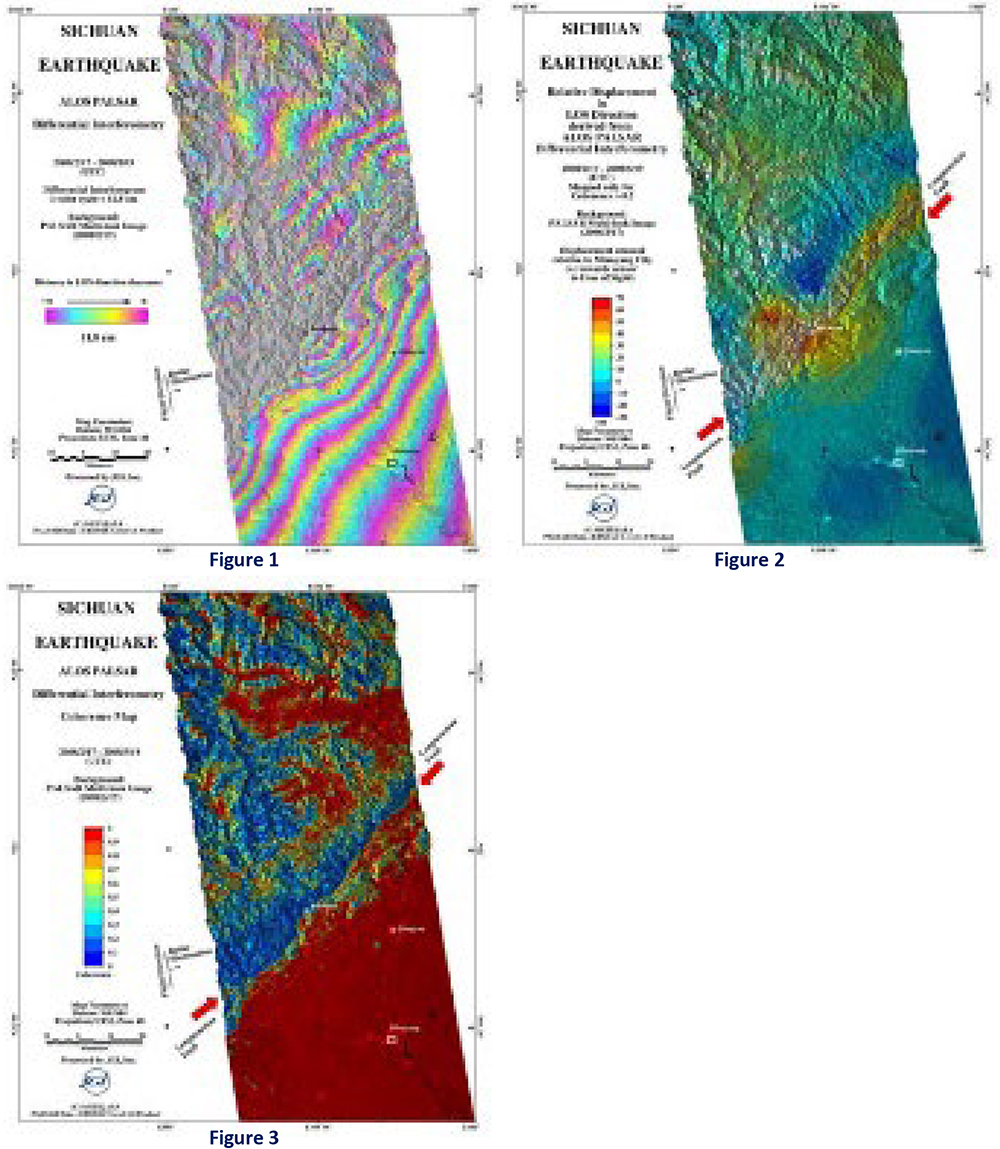
The Sichuan Earthquake, which occurred in Sichuan Province, China, on May 12, 2008, was caused by the activity along the Longmenshan Fault, which extends over 200 km, resulting in widespread and devastating damage. Figure 1 shows the differential interferogram around the northern part of the Longmenshan Fault. Figure 2 converts the interferogram phase into satellite‘s line-of-sight displacement, with shortening exceeding 60 cm in some areas (shown in red). The blue areas on the northern block of the fault (indicated by red arrows) corresponds to moving away from the satellite (eastward), while the yellow to red areas indicate moving toward the satellite (westward). This indicates that the fault activity involved right-lateral strike-slip motion in addition to vertical displacement. Figure 3 shows coherence, a measure obtained during InSAR processing. Coherence decreases where surface conditions have changed between the two observations. North of the inferred Longmenshan Fault, coherence is significantly lower than to the south, indicating that the surface of the northern block (the hanging wall) was severely disturbed by the earthquake. Beichuan Prefecture (located almost in the center of the figure), which suffered from extremely severe damage, is located almost directly above the fault, as can be clearly inferred from this figure.
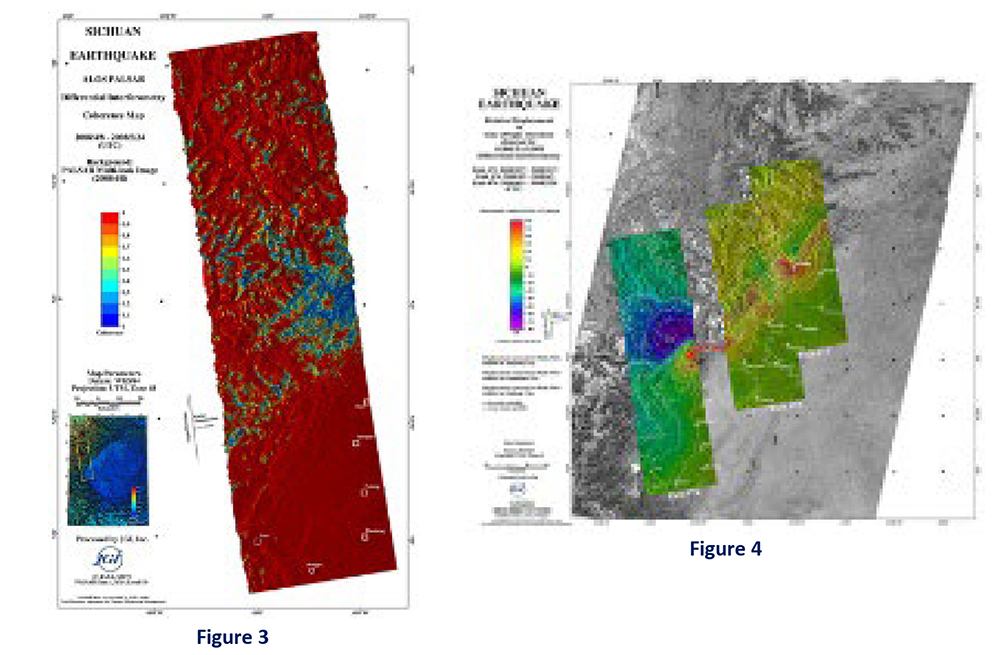
The interferogram of Path 476 was generated from SAR data acquired on April 8 and May 24, 2008. In this image, the epicenter of the Sichuan Earthquake corresponds to the red area near the central-eastern edge of the interferogram strip. In Path 473, the relative difference in line-of-sight displacement is approximately 80 cm (ranging from -20 to +60 cm), whereas in Path 476, it reaches about 140 cm (ranging from -80 to +60 cm). This suggests that extremely large displacement differences occurred near the epicenter. Considering the northeast?southwest extension of the Longmenshan Fault, which is visible in the background Landsat 7 image, the reversal of displacement signs near the epicenter indicates that the result may reflect strike-slip displacement more strongly than vertical uplift and subsidence components.