Latest Technical Service
Remote Sensing Technology Service Examples

2018 Hokkaido Eastern Iburi Earthquake
Results of Differential Interferometric SAR (DInSAR) Analysis
Latest Technical Services
Remote Sensing Technology Service Examples
2018 Hokkaido Eastern Iburi Earthquake
Results of Differential Interferometric SAR (DInSAR) Analysis
This is the result of differential interferometric SAR processing using SAR data from Sentinel-1 satellite operated by the ESA, acquired before and after “The 2018 Hokkaido Eastern Iburi Earthquake” (September 6, 2018, 03:07 JST).
(1) Differential interferogram
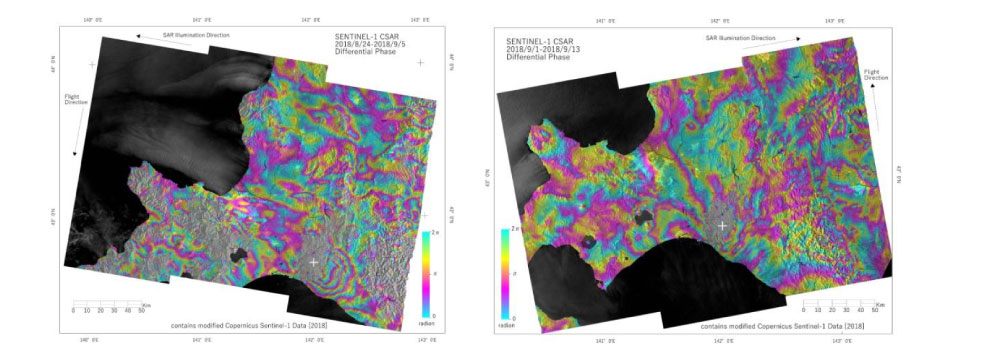
The above figure is the phase of the differential interferogram obtained by differential interference SAR processing using the data observed before and after the earthquake. The left figure shows the result of using the data observed in descending orbit (the orbit in which the satellite flies from north to south) on August 24, 2018 and September 5, 2018 (UTC), and the right figure shows the result of using the data observed in ascending orbit (the orbit in which the satellite flies from south to north) on September 1, 2018 and September 13, 2018 (UTC). The Sentinel-1 SAR data is C band (wavelength = 5.6 cm), and the phase change of one cycle corresponds to the surface displacement of half wavelength = 2.8 cm in the satellite’s line-of-sight direction. The increase of phase means that the distance increases (= movement away from the satellite). In both results, transient phase noise appears in the whole scene due to the effect of atmospheric delay or other effects, but focusing on the epicenter area (white + mark in the figure), no interferometric signals are found around the epicenter, and phase change due to surface displacement is observed on the east side and the west side.
(2) Line-of-Sight Displacement
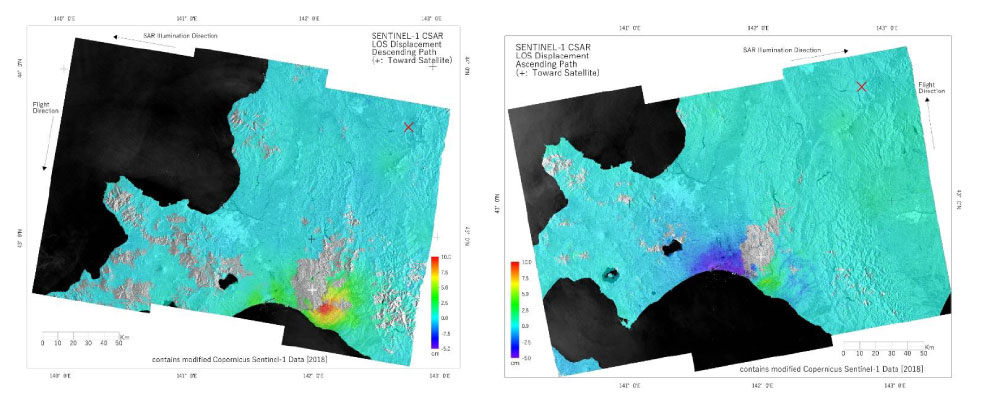
The figure above shows the distribution of line-of-sight displacement derived from descending-orbit data (left figure) and ascending-orbit data (right figure). In addition to the interferogram pairs described in (1), four pre- and post-event interferogram pairs were generated for each orbit. After reducing phase noise, unwrapping the phase, and stacking the results, the data were converted into line-of-sight displacement. Displacement toward the satellite is expressed as positive values. For descending-orbit data, positive value corresponds to motion eastward and/or uplift, while for ascending-orbit data, positive value corresponds to motion westward and/or uplift. The GPS-based Control Station reference point “Higashikawa” (marked by a red “X” symbol) is used as the reference point for displacement obtained from the InSAR results, and the displacement is the relative displacement measured from this reference point. In the descending-orbit data, displacements of up to about 10 cm toward the satellite are observed southeast of the epicenter. In the ascending-orbit data, displacements of up to about 5 cm away from the satellite are observed near “Tomakomai” to the west of the epicenter. Areas of low coherence have been masked.
(3) Results of 2.5-dimensional analysis
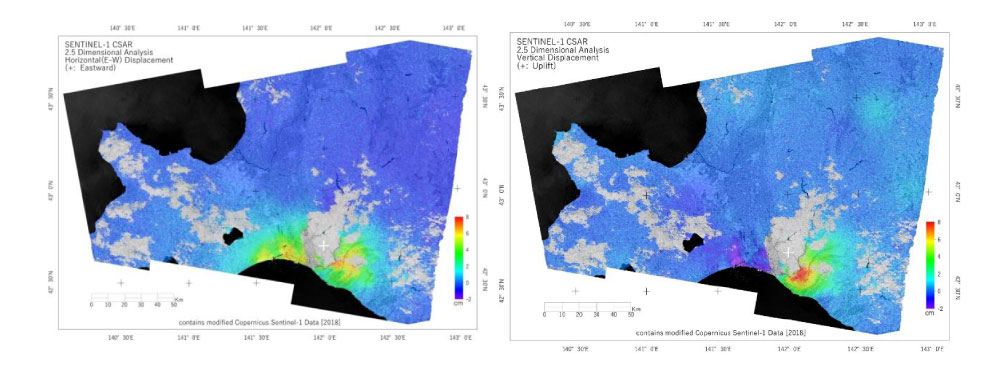
The figure above shows quasi-east-west (left) and quasi-vertical (right) displacement distributions obtained through 2.5-dimensional analysis using line-of-sight displacement data from both descending and ascending orbits. In the quasi-east?west direction, eastward displacements of up to about 8 cm are observed east of the epicenter and up to about 7 cm west of the epicenter. In the quasi-vertical direction, uplift of up to about 9 cm is observed east of the epicenter, while subsidence of up to about 3 cm is observed west of the epicenter. The displacement area east of the epicenter extends about 40 km in the NE?SW direction and about 40 km southeastward, reaching as far as the “Monbetsu” area. The displacement area west of the epicenter extends about 20 km north?south and about 60 km westward, reaching as far as the “Shiraoi” area. The epicentral region appears as a decorrelated zone, suggesting significant changes in surface conditions caused by the earthquake. (These results were presented at the 2018 Autumn Meeting of the Japan Association for Active Fault Studies.)