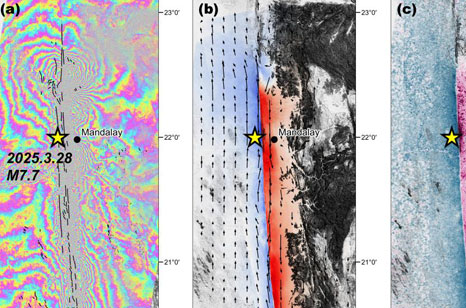

2025年3月28日に発生したミャンマー地震(Mw7.7)は,全長400 km以上に及ぶザガイン断層を震源断層とする地震である。衛星画像データ(Sentinel-1およびSentinel-2)を用い、ピクセルオフセット法と干渉SAR解析を組み合わせて地震前後の干渉縞を作成した(図(a))。複数の干渉解析により、ザガイン断層の直上から周辺の広域にわたる三成分変位を推定することができ、非一様な地表変位分布が明らかになった(図(b)、(c)、(d))。主断層における最大水平食い違い量は約6 m、最大垂直食い違い量は約1 mに達しており、主断層から離れた周辺領域や断層末端部では10 cm未満の小規模変位も検出された。これらリモートセンシングに基づく解析は、プレート境界周辺に存在する長大な横ずれ断層系の変形様式解明に向けた重要な基礎データを提供する。